Atlas variant · ROI edition
Best kitchen ROI by state — 2026.
Same 50-state pricing as the main atlas, ranked by projected resale recoup. A kitchen remodel in a hot Sunbelt market typically returns 70-75% at sale; in a slower-resale region it returns 58-62%. Net out-of-pocket per state shown below — sortable by ROI %, by net cost, or by install cost.
50 states · national avg ROI 73%
| State | Install cost | Resale lift | Net out-of-pocket | ROI % | |
|---|---|---|---|---|---|
 NCNorth Carolina NCNorth Carolina | $43,100 | +$36,600 | $6,500 | 85% | Read guide |
 GAGeorgia GAGeorgia | $42,300 | +$35,500 | $6,800 | 84% | Read guide |
 TNTennessee TNTennessee | $41,000 | +$34,400 | $6,600 | 84% | Read guide |
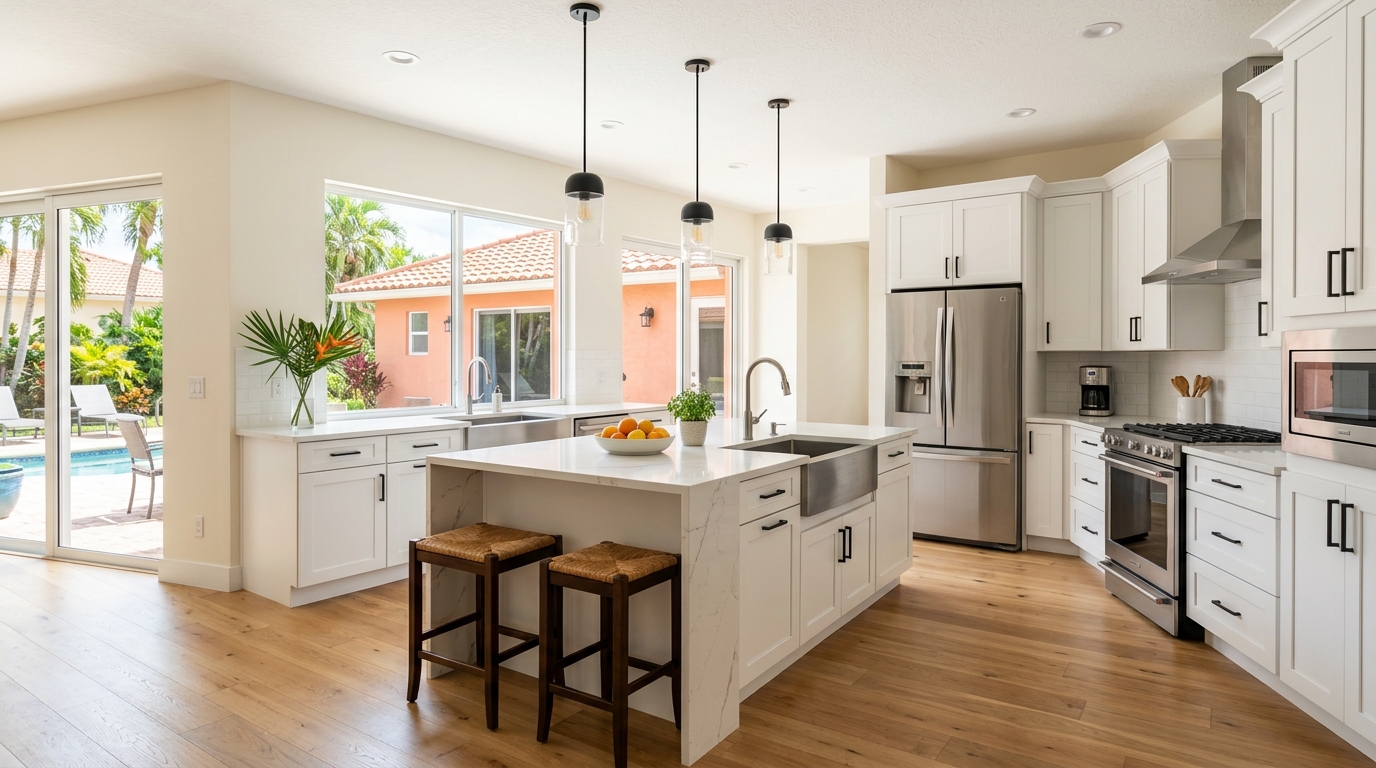 FLFlorida FLFlorida | $44,000 | +$36,100 | $7,900 | 82% | Read guide |
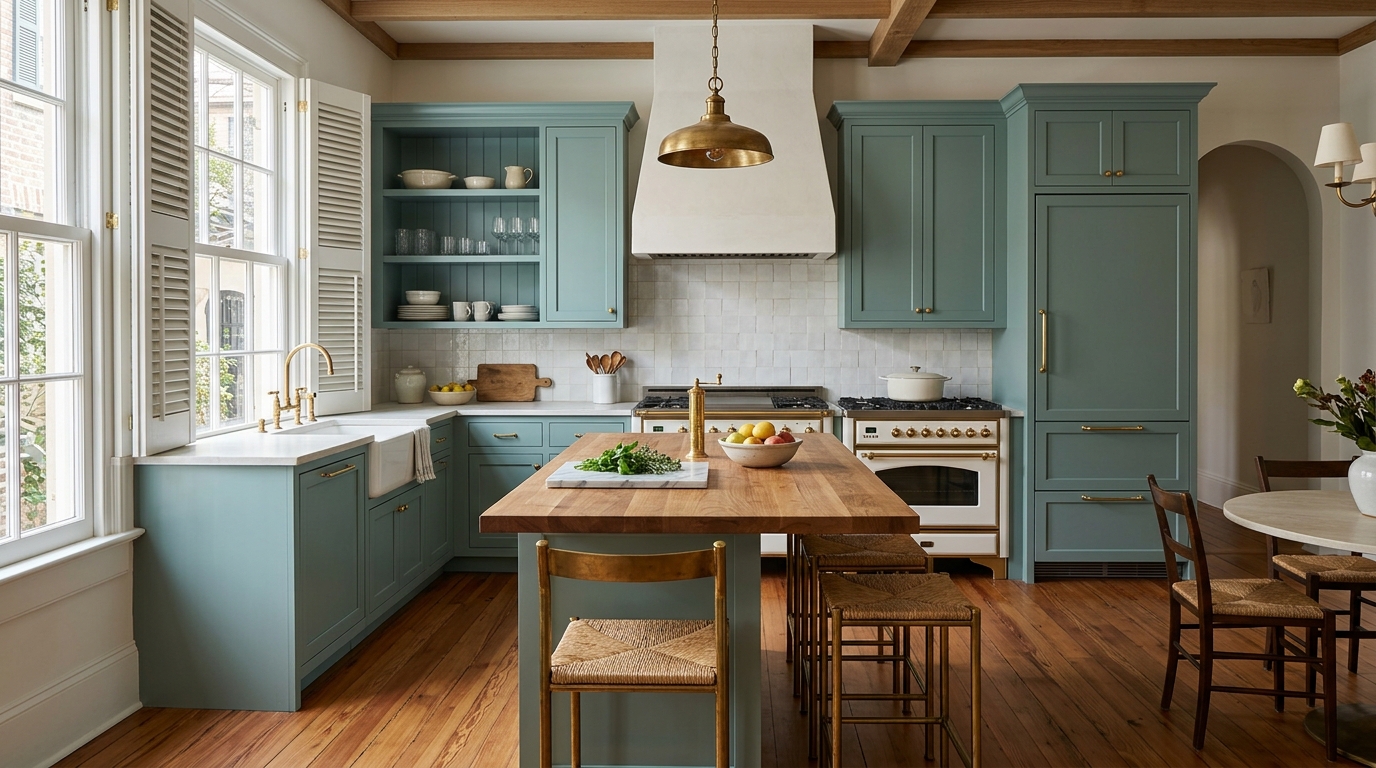 SCSouth Carolina SCSouth Carolina | $41,900 | +$34,400 | $7,500 | 82% | Read guide |
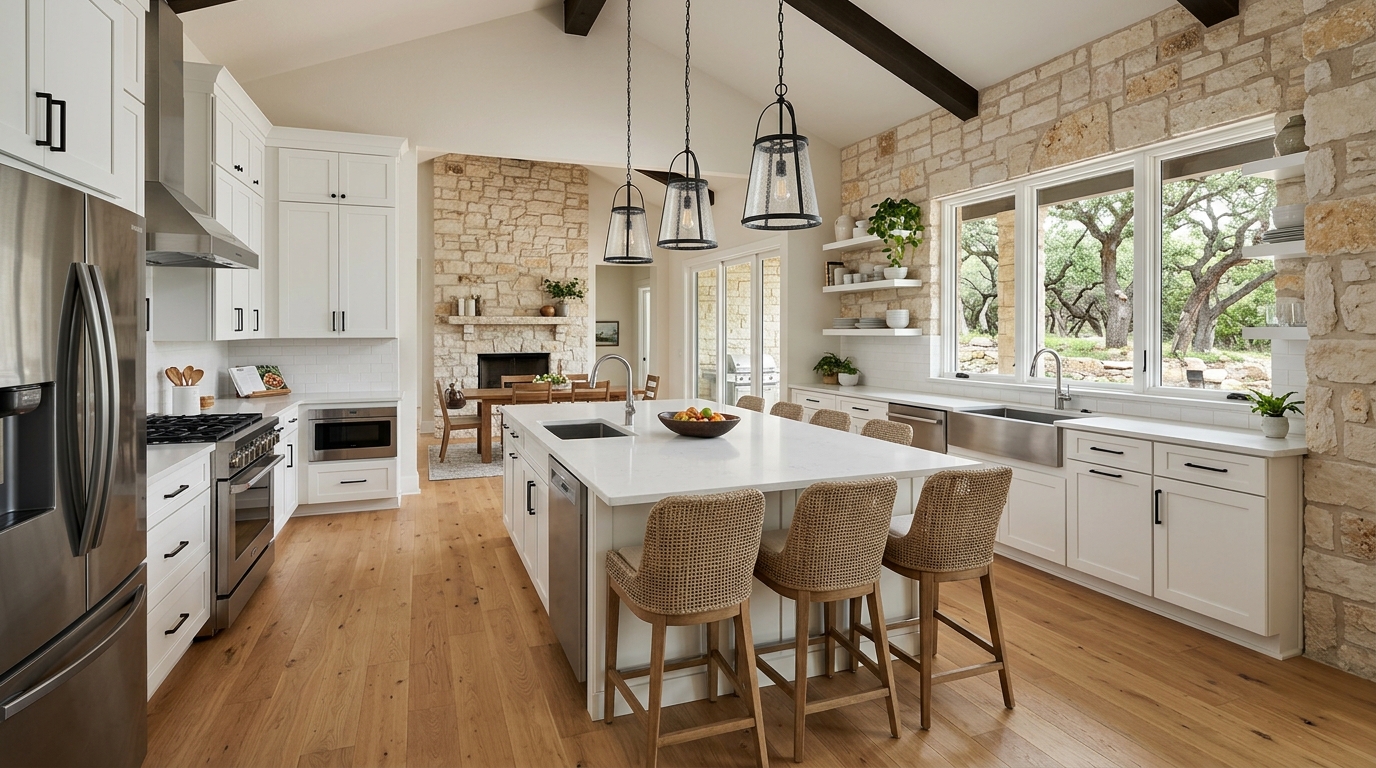 TXTexas TXTexas | $44,000 | +$36,100 | $7,900 | 82% | Read guide |
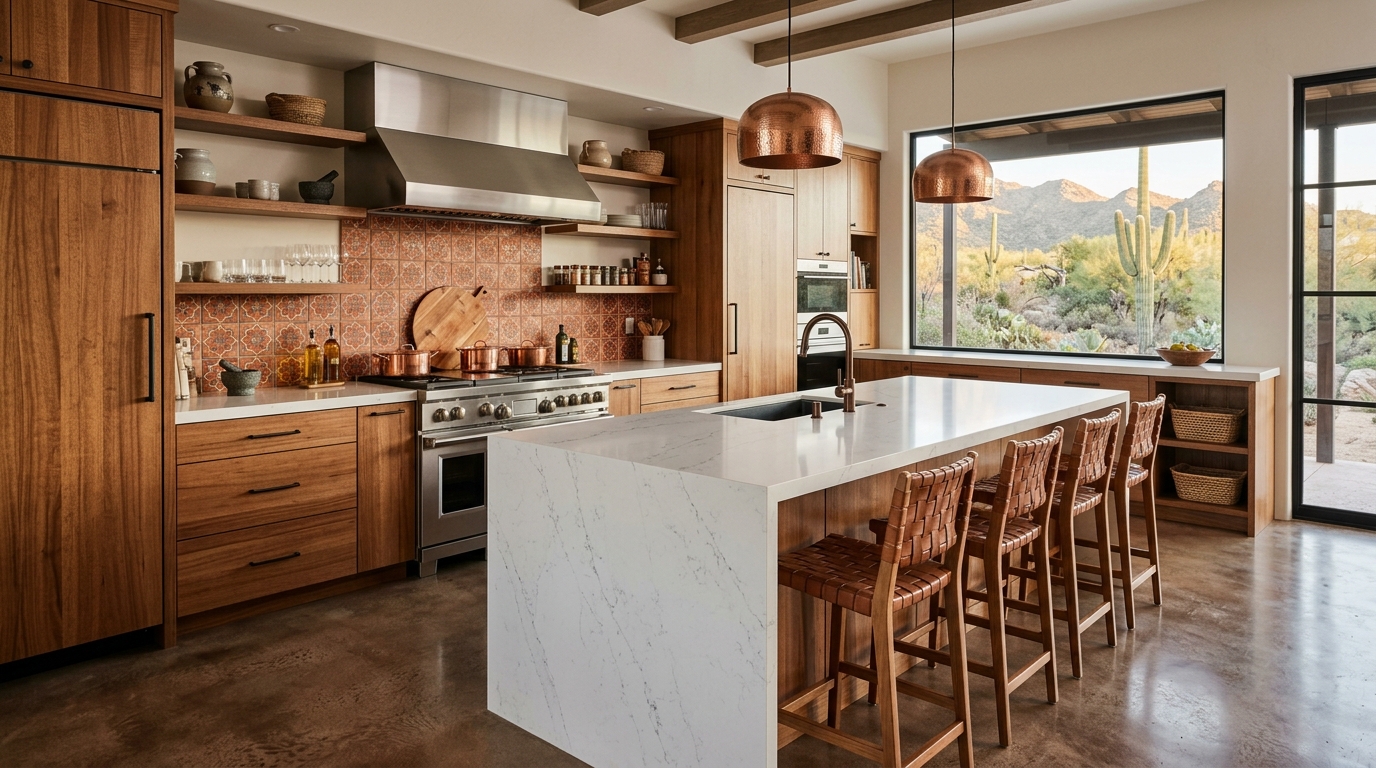 AZArizona AZArizona | $44,000 | +$35,600 | $8,400 | 81% | Read guide |
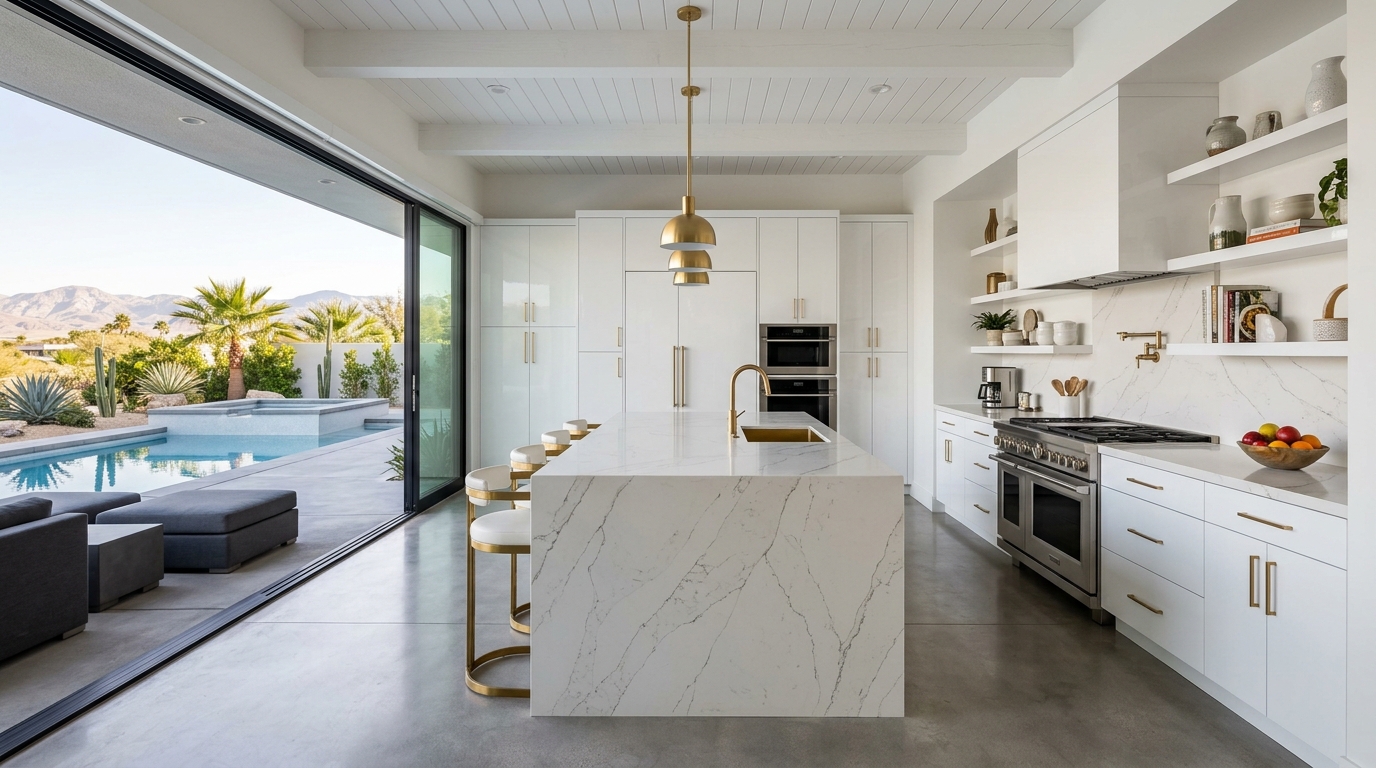 NVNevada NVNevada | $46,300 | +$37,500 | $8,800 | 81% | Read guide |
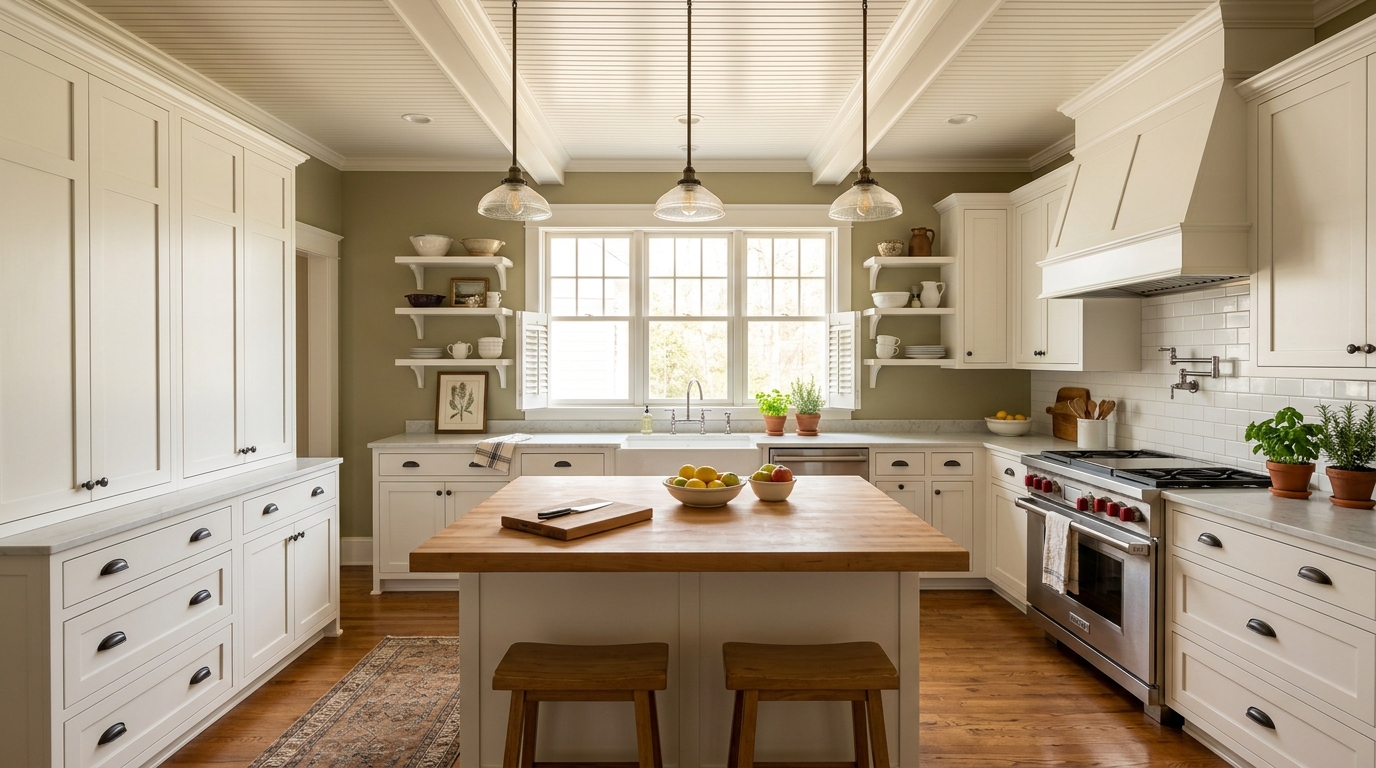 ALAlabama ALAlabama | $37,900 | +$29,900 | $8,000 | 79% | Read guide |
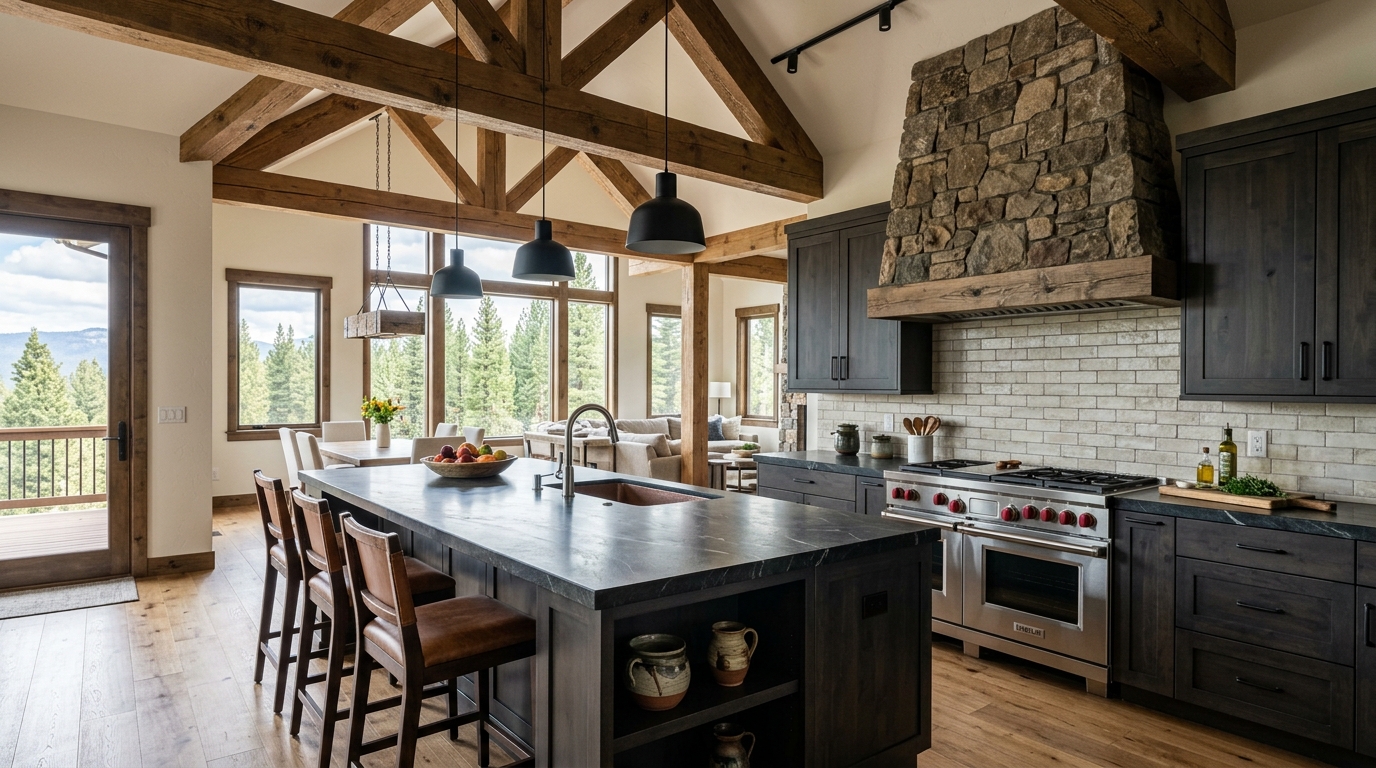 IDIdaho IDIdaho | $40,500 | +$32,000 | $8,500 | 79% | Read guide |
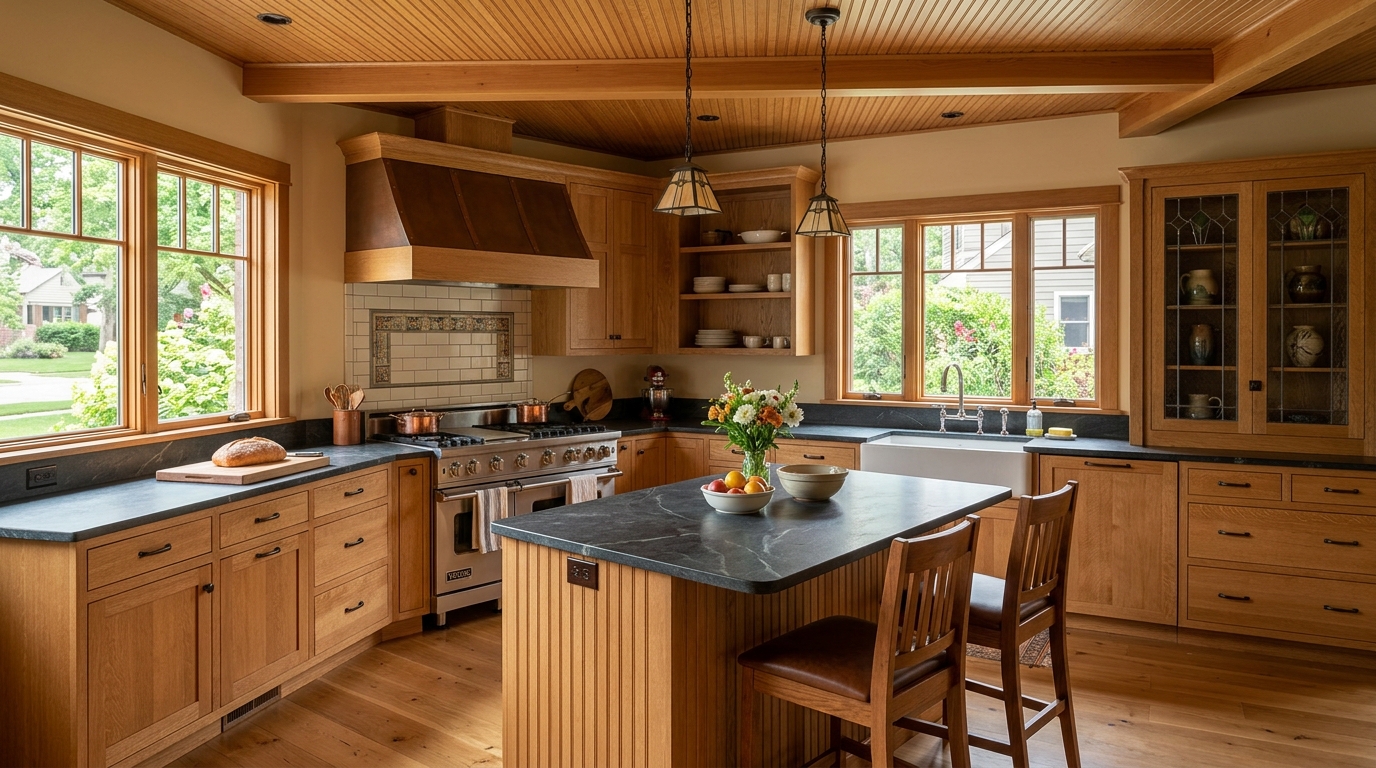 INIndiana INIndiana | $38,700 | +$30,600 | $8,100 | 79% | Read guide |
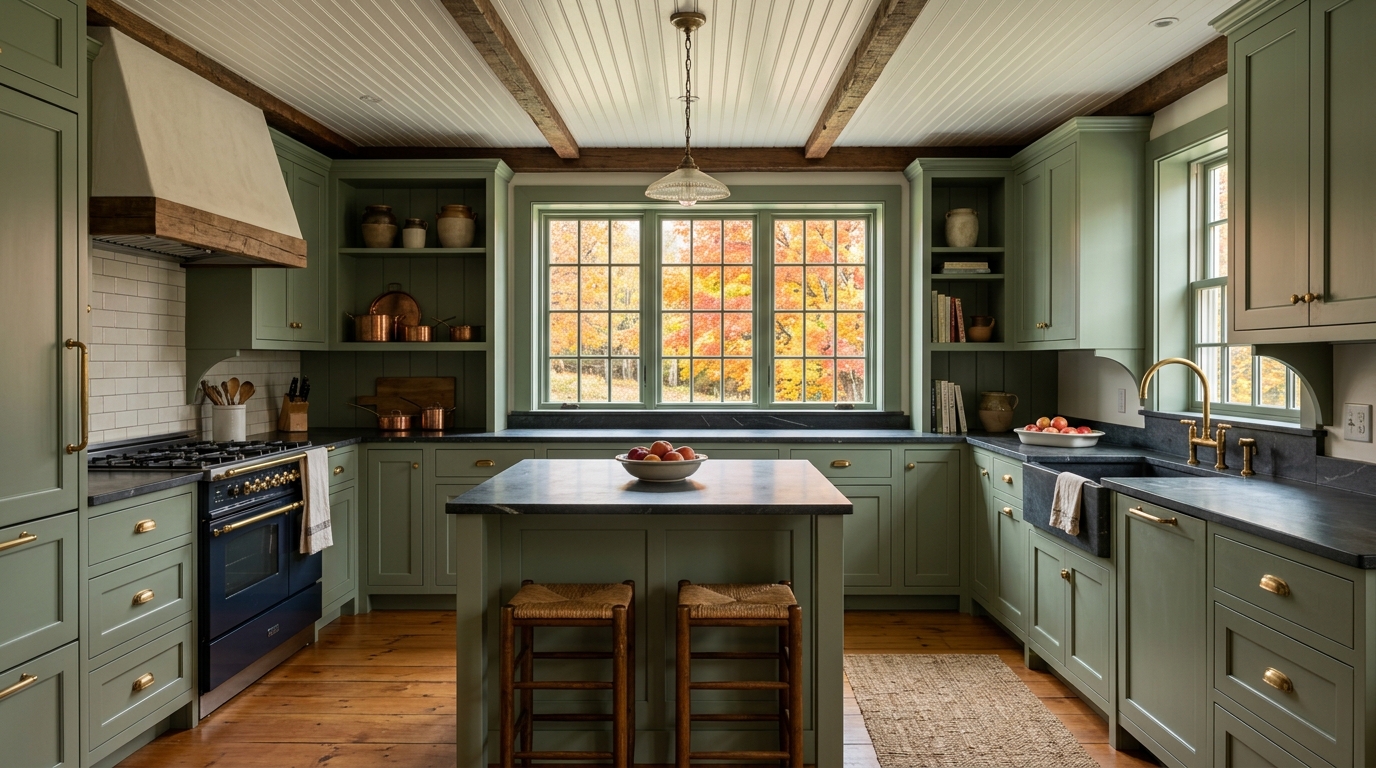 NHNew Hampshire NHNew Hampshire | $50,600 | +$40,000 | $10,600 | 79% | Read guide |
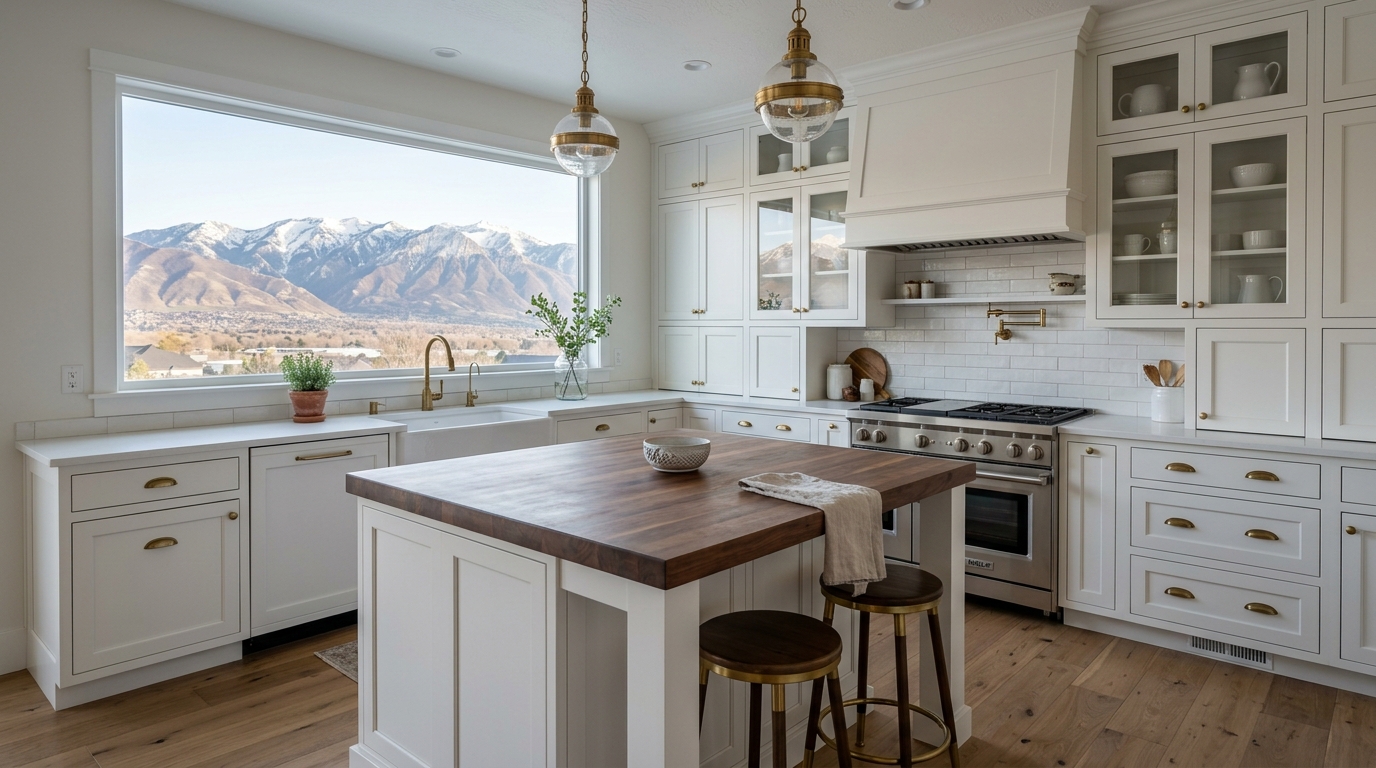 UTUtah UTUtah | $44,900 | +$35,500 | $9,400 | 79% | Read guide |
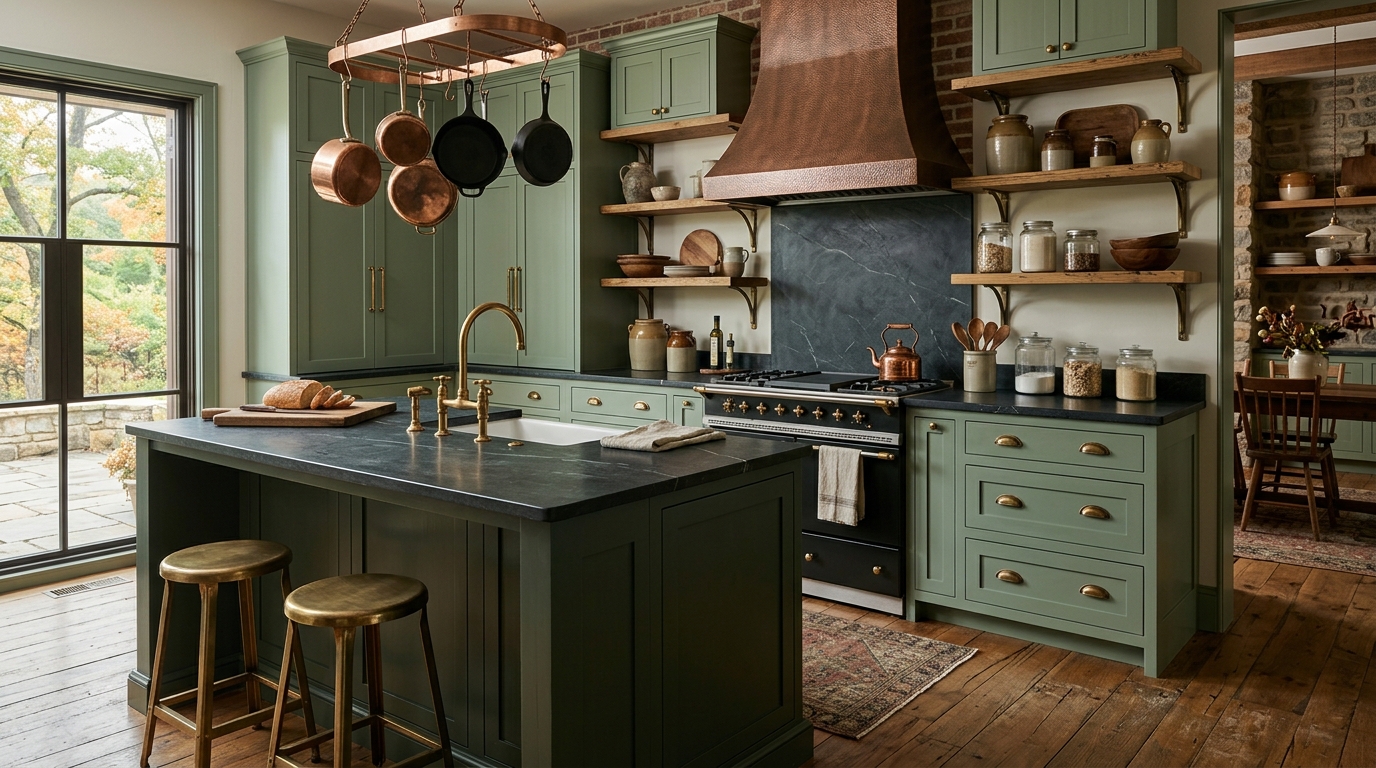 ARArkansas ARArkansas | $37,500 | +$29,300 | $8,200 | 78% | Read guide |
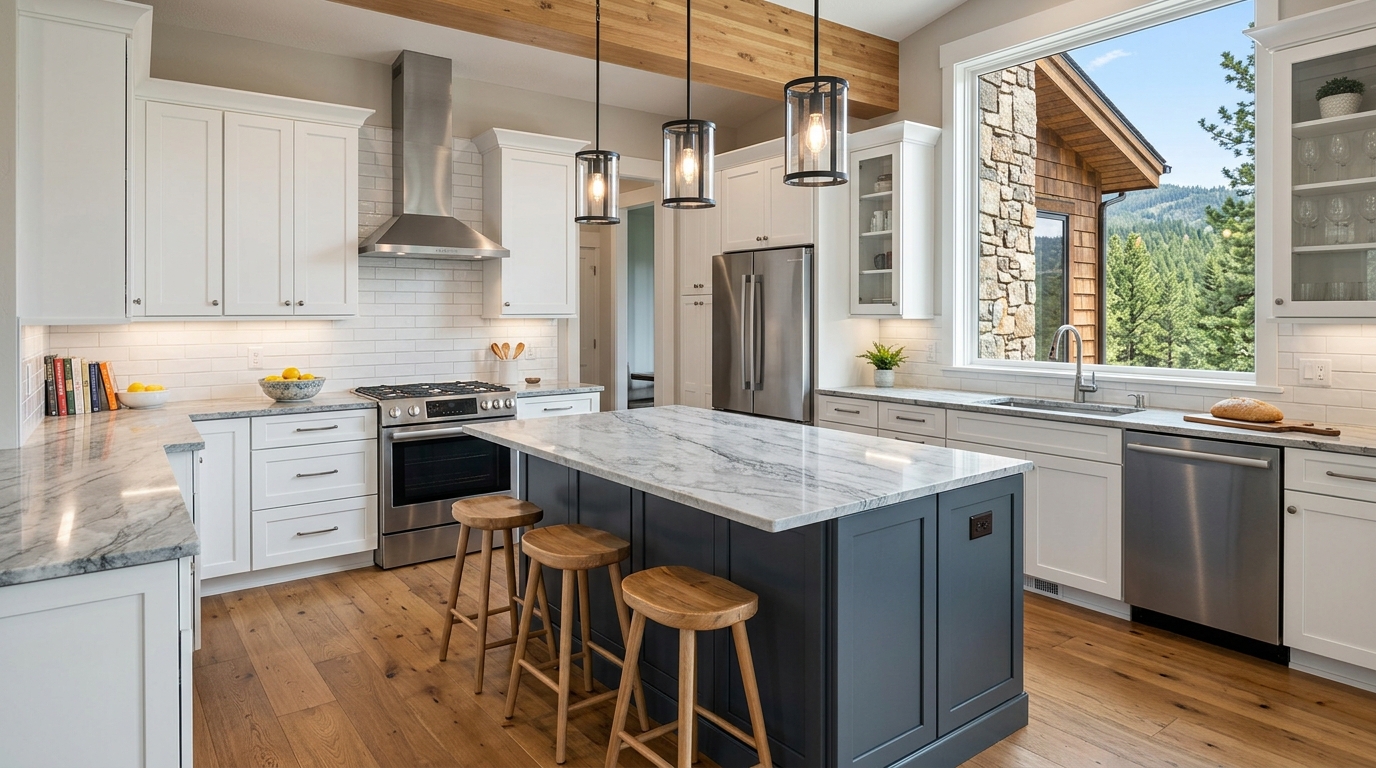 COColorado COColorado | $50,600 | +$39,500 | $11,100 | 78% | Read guide |
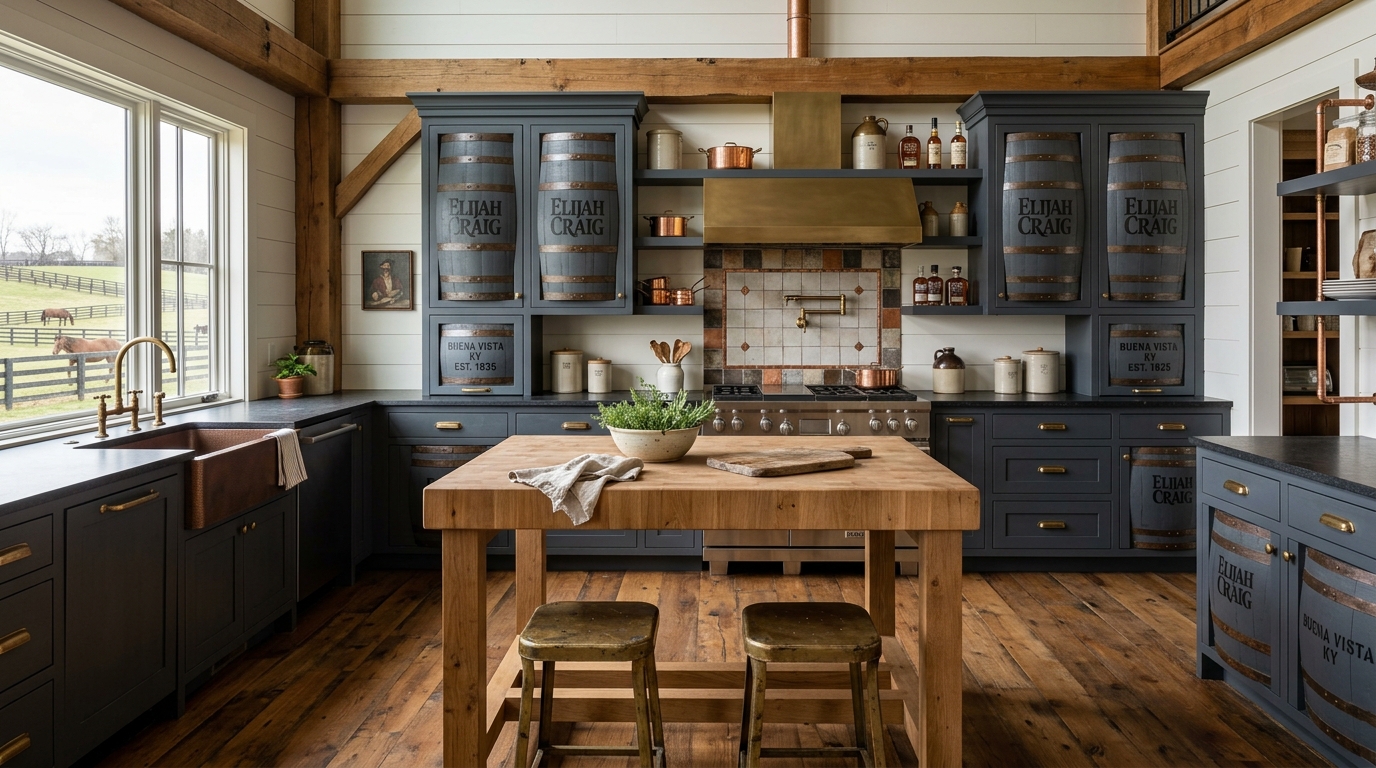 KYKentucky KYKentucky | $39,600 | +$30,900 | $8,700 | 78% | Read guide |
 OHOhio OHOhio | $40,500 | +$31,600 | $8,900 | 78% | Read guide |
 OKOklahoma OKOklahoma | $37,900 | +$29,600 | $8,300 | 78% | Read guide |
 MSMississippi MSMississippi | $37,000 | +$27,800 | $9,200 | 75% | Read guide |
 VAVirginia VAVirginia | $47,500 | +$35,600 | $11,900 | 75% | Read guide |
 KSKansas KSKansas | $38,700 | +$28,300 | $10,400 | 73% | Read guide |
 LALouisiana LALouisiana | $40,500 | +$29,600 | $10,900 | 73% | Read guide |
 MDMaryland MDMaryland | $52,800 | +$38,500 | $14,300 | 73% | Read guide |
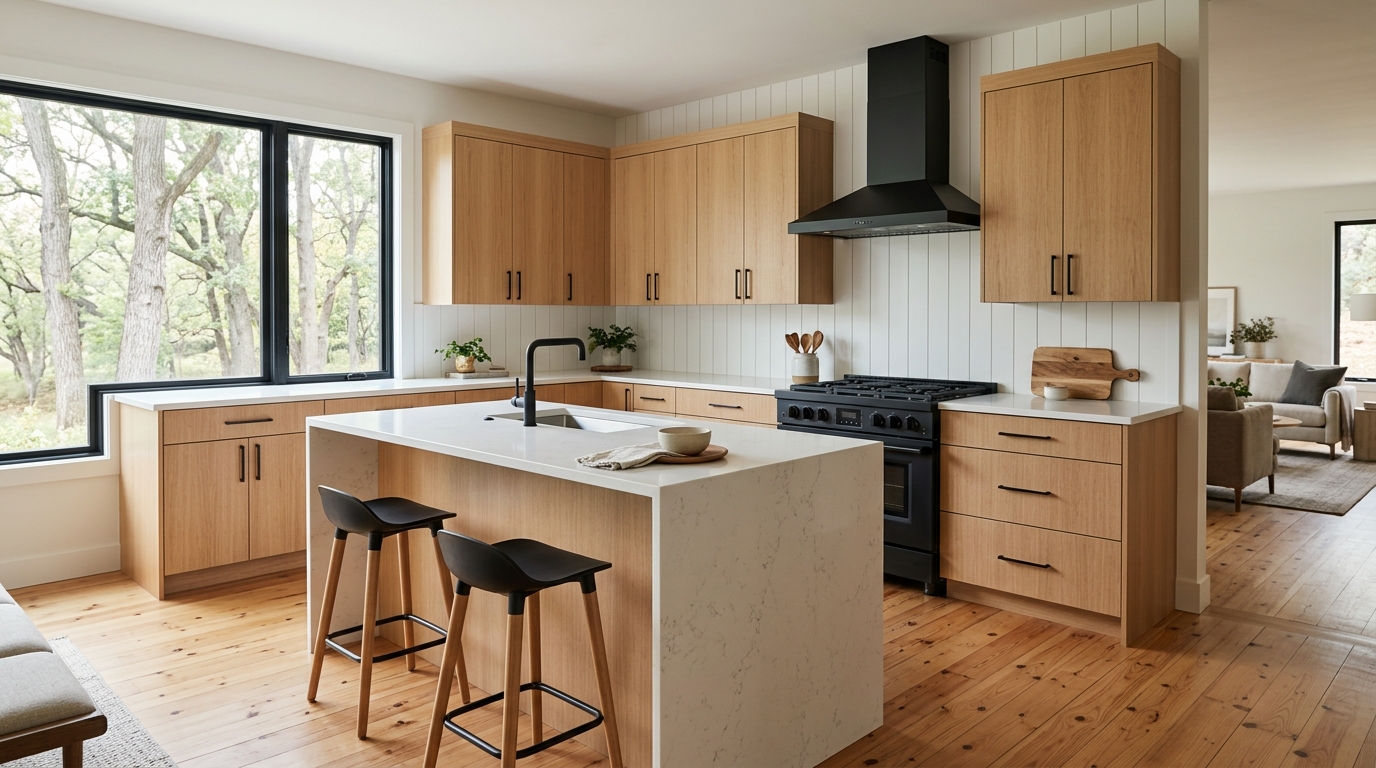 MNMinnesota MNMinnesota | $44,000 | +$32,100 | $11,900 | 73% | Read guide |
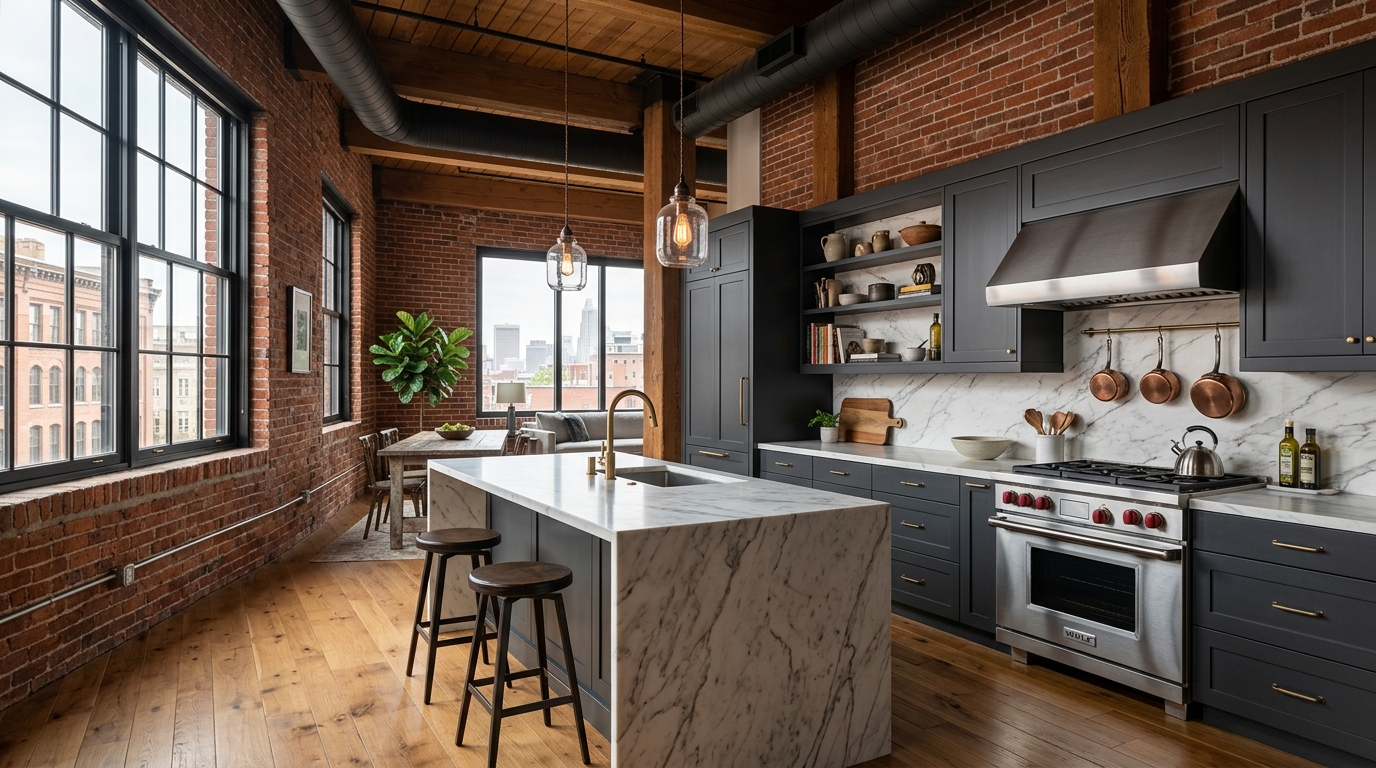 MOMissouri MOMissouri | $40,100 | +$29,300 | $10,800 | 73% | Read guide |
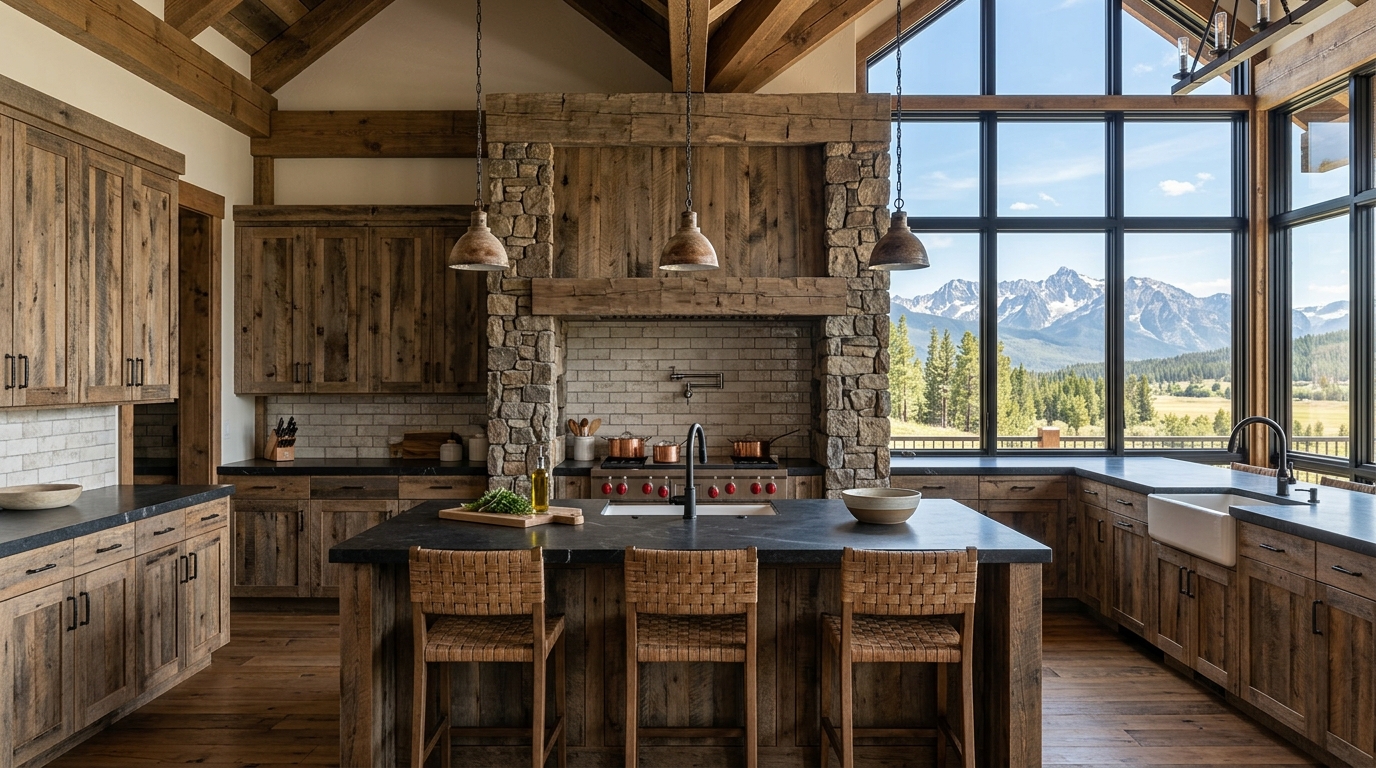 MTMontana MTMontana | $42,700 | +$31,200 | $11,500 | 73% | Read guide |
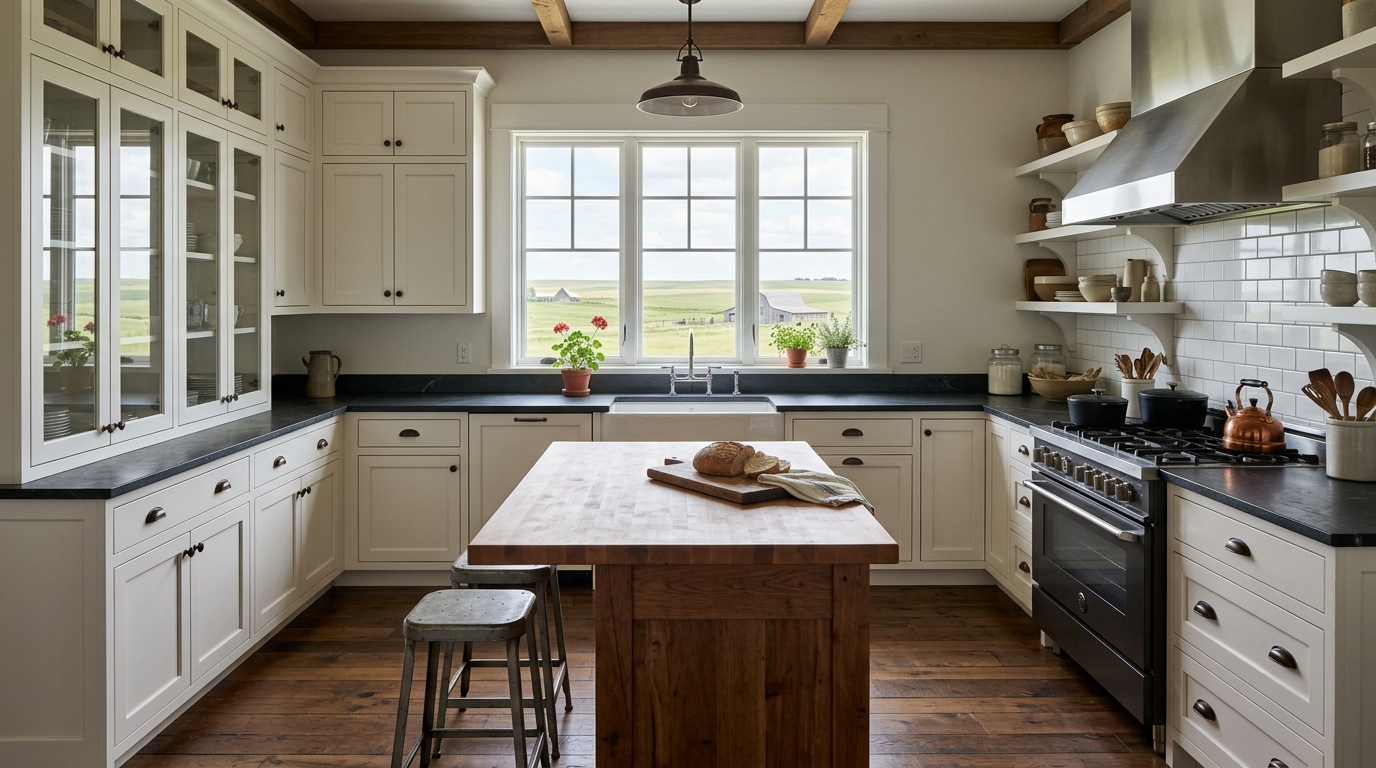 NDNorth Dakota NDNorth Dakota | $37,900 | +$27,700 | $10,200 | 73% | Read guide |
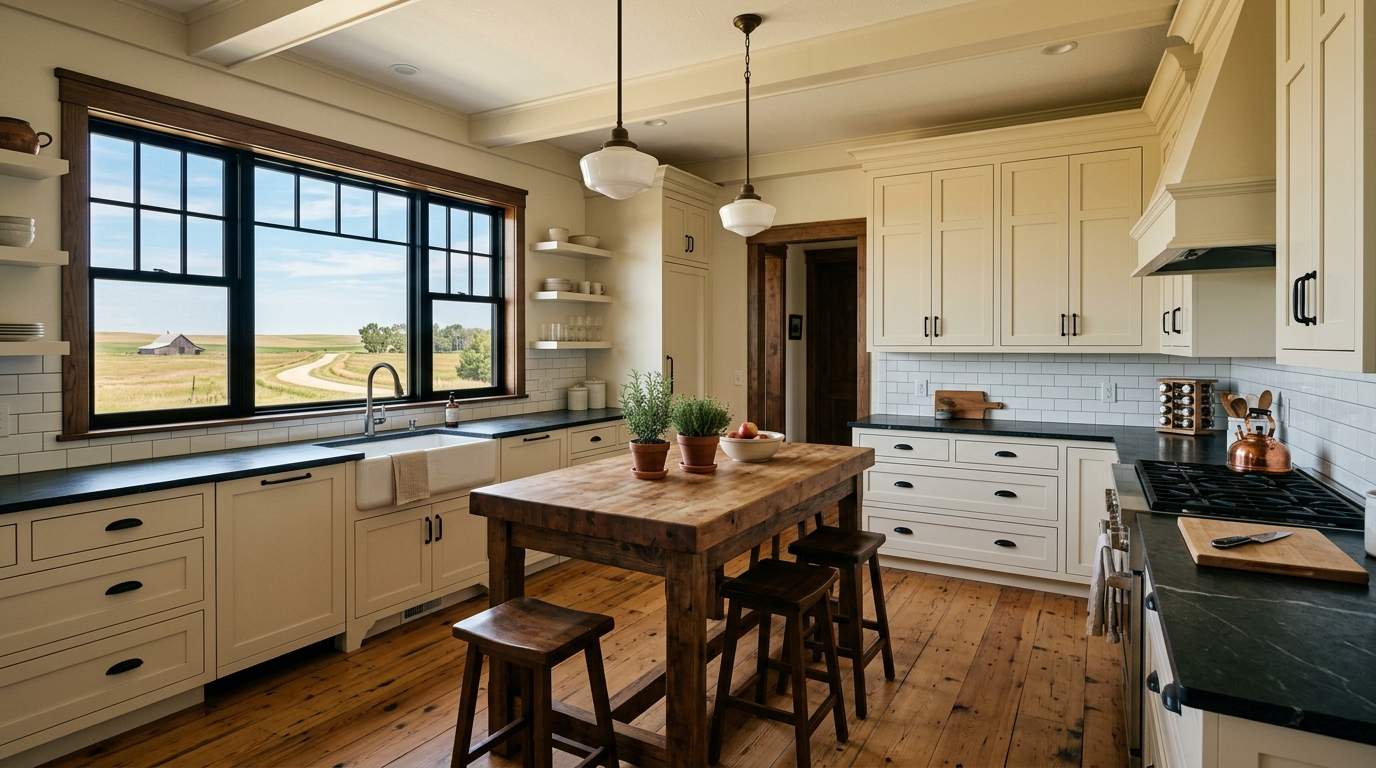 SDSouth Dakota SDSouth Dakota | $37,500 | +$27,400 | $10,100 | 73% | Read guide |
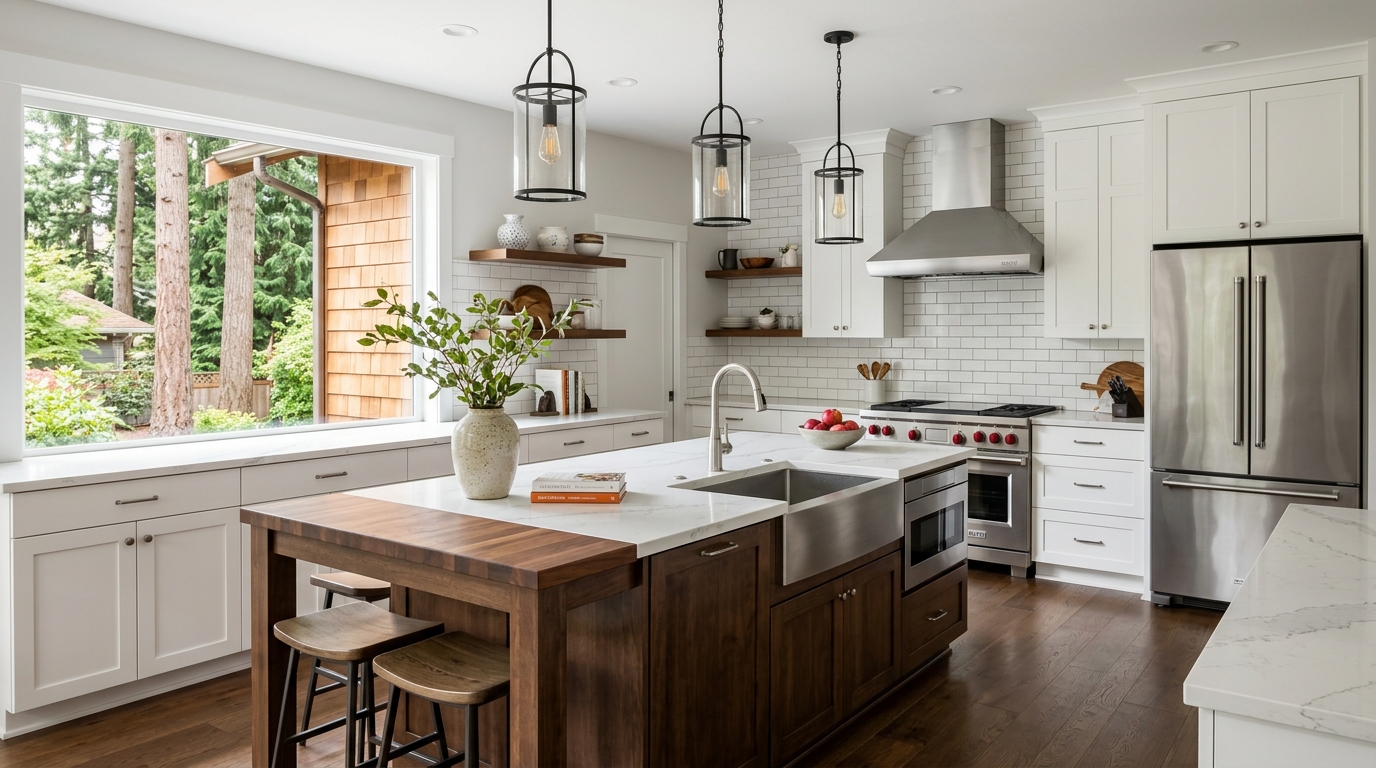 WAWashington WAWashington | $51,900 | +$37,900 | $14,000 | 73% | Read guide |
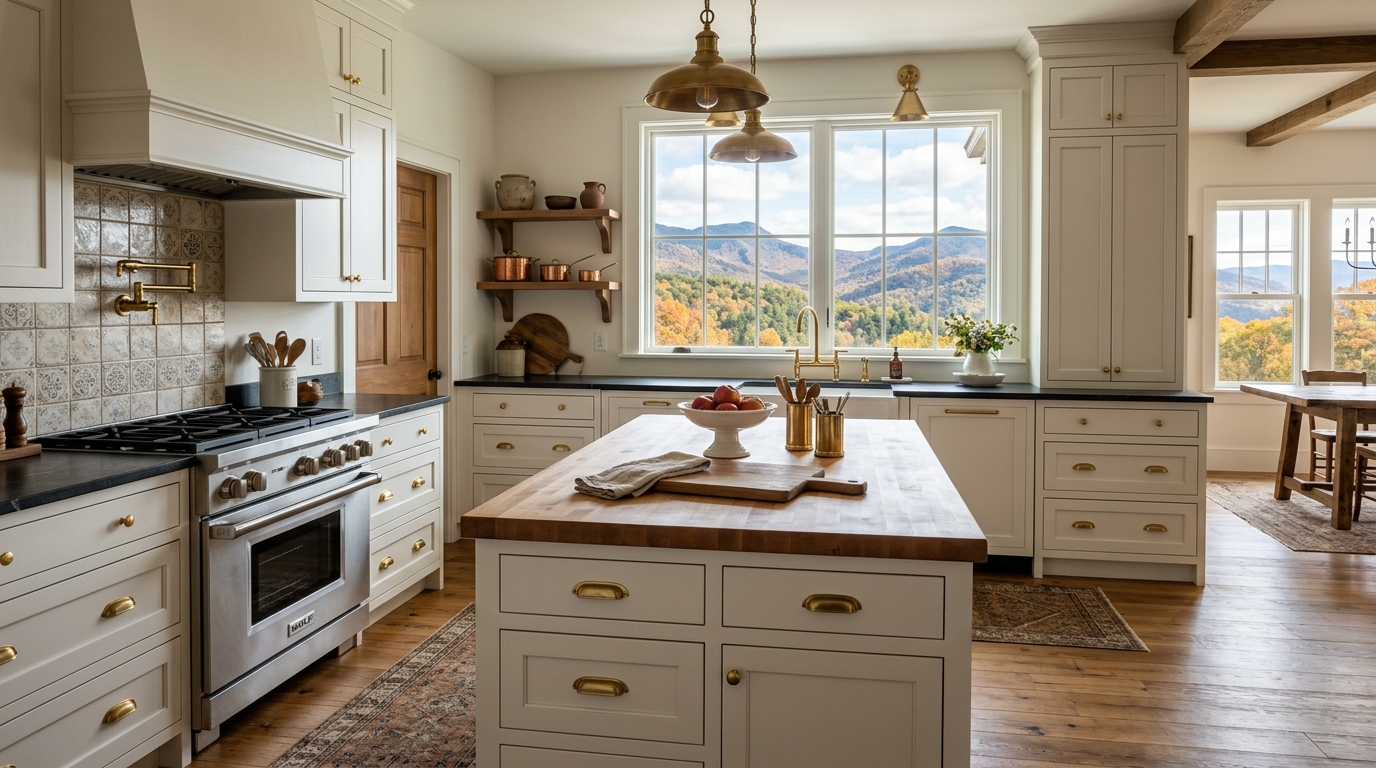 WVWest Virginia WVWest Virginia | $37,500 | +$27,400 | $10,100 | 73% | Read guide |
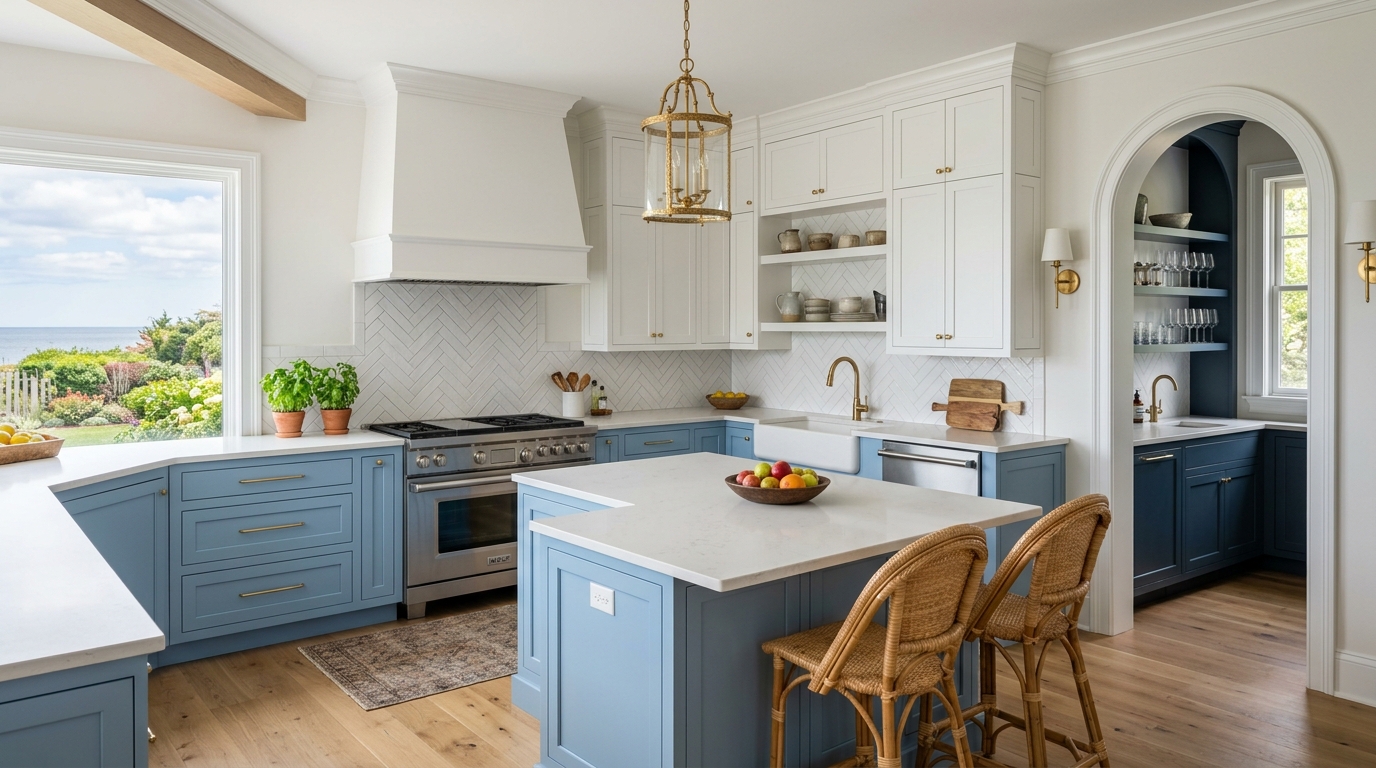 DEDelaware DEDelaware | $46,300 | +$33,300 | $13,000 | 72% | Read guide |
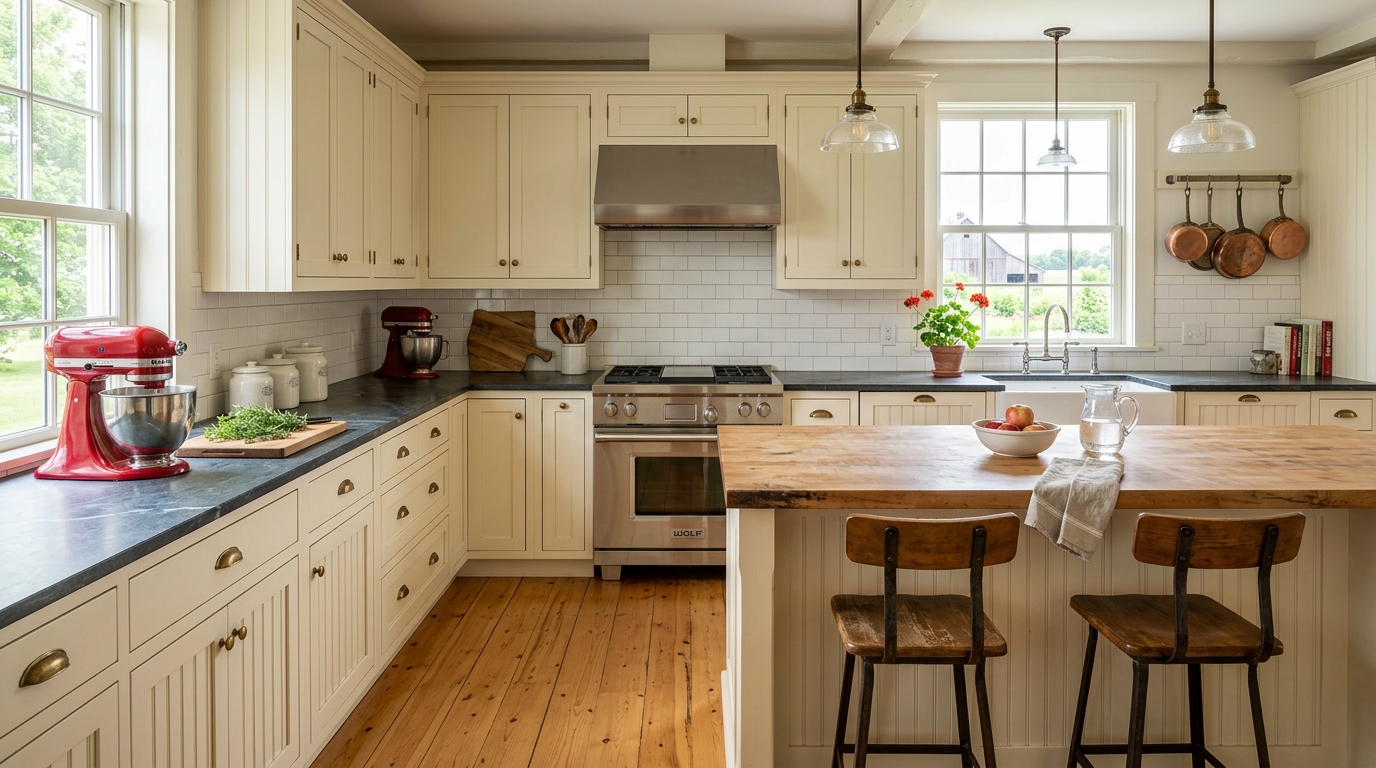 IAIowa IAIowa | $37,900 | +$27,300 | $10,600 | 72% | Read guide |
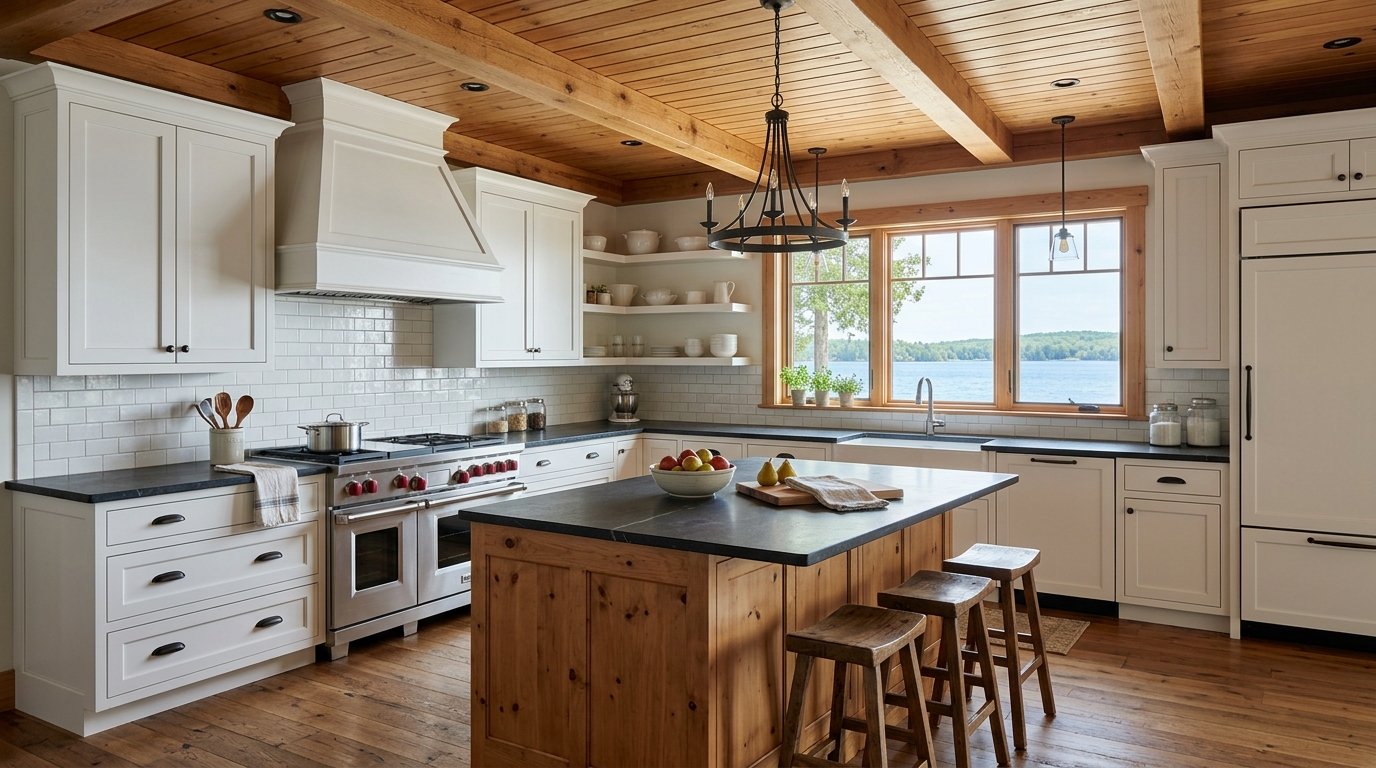 MIMichigan MIMichigan | $40,100 | +$28,900 | $11,200 | 72% | Read guide |
 NENebraska NENebraska | $38,300 | +$27,600 | $10,700 | 72% | Read guide |
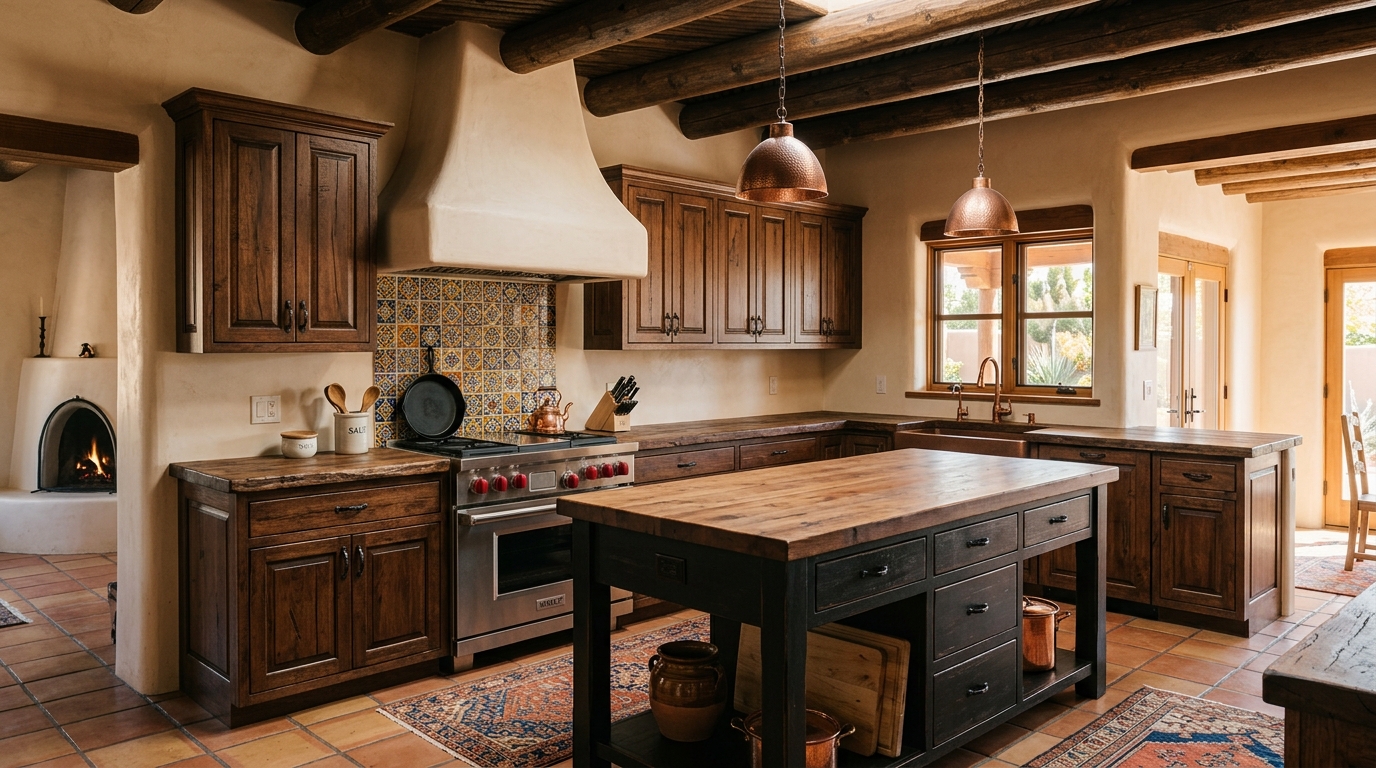 NMNew Mexico NMNew Mexico | $41,400 | +$29,800 | $11,600 | 72% | Read guide |
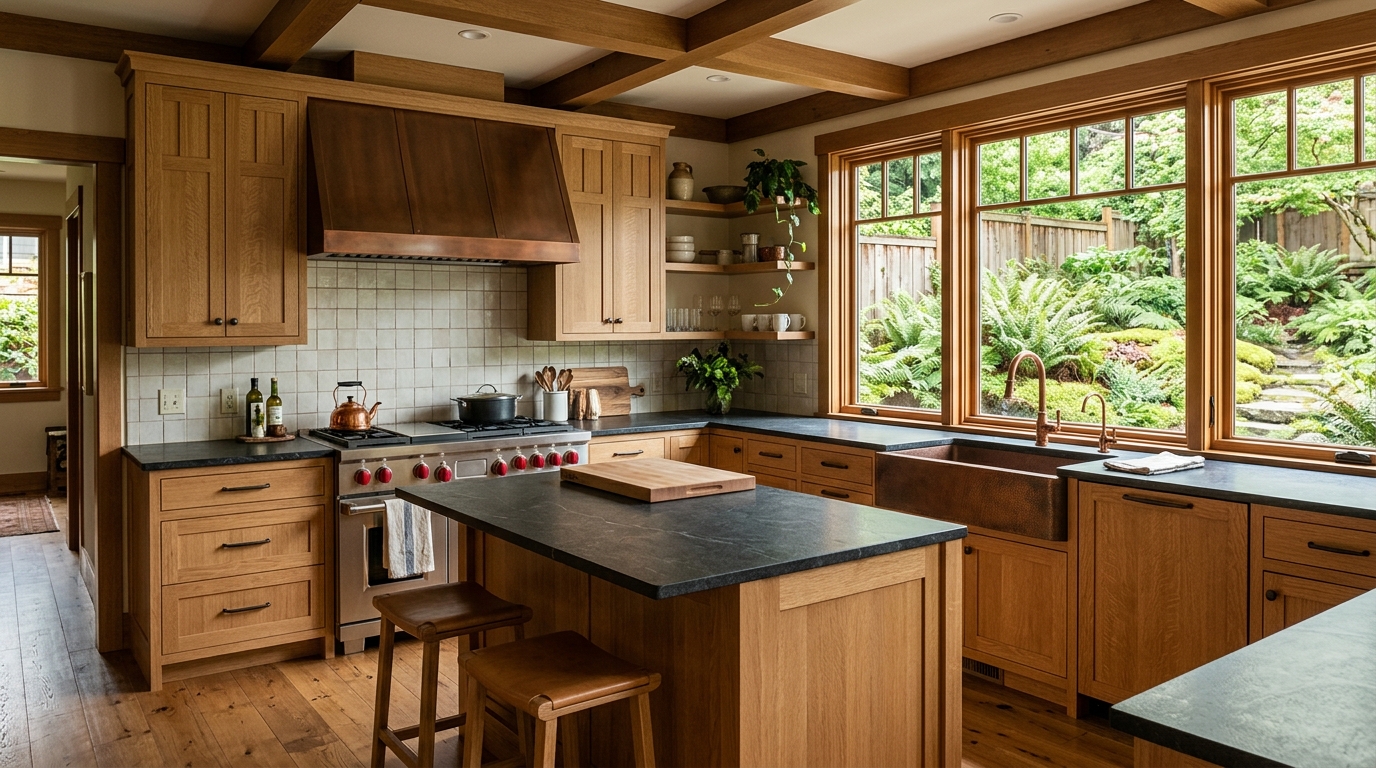 OROregon OROregon | $49,300 | +$35,500 | $13,800 | 72% | Read guide |
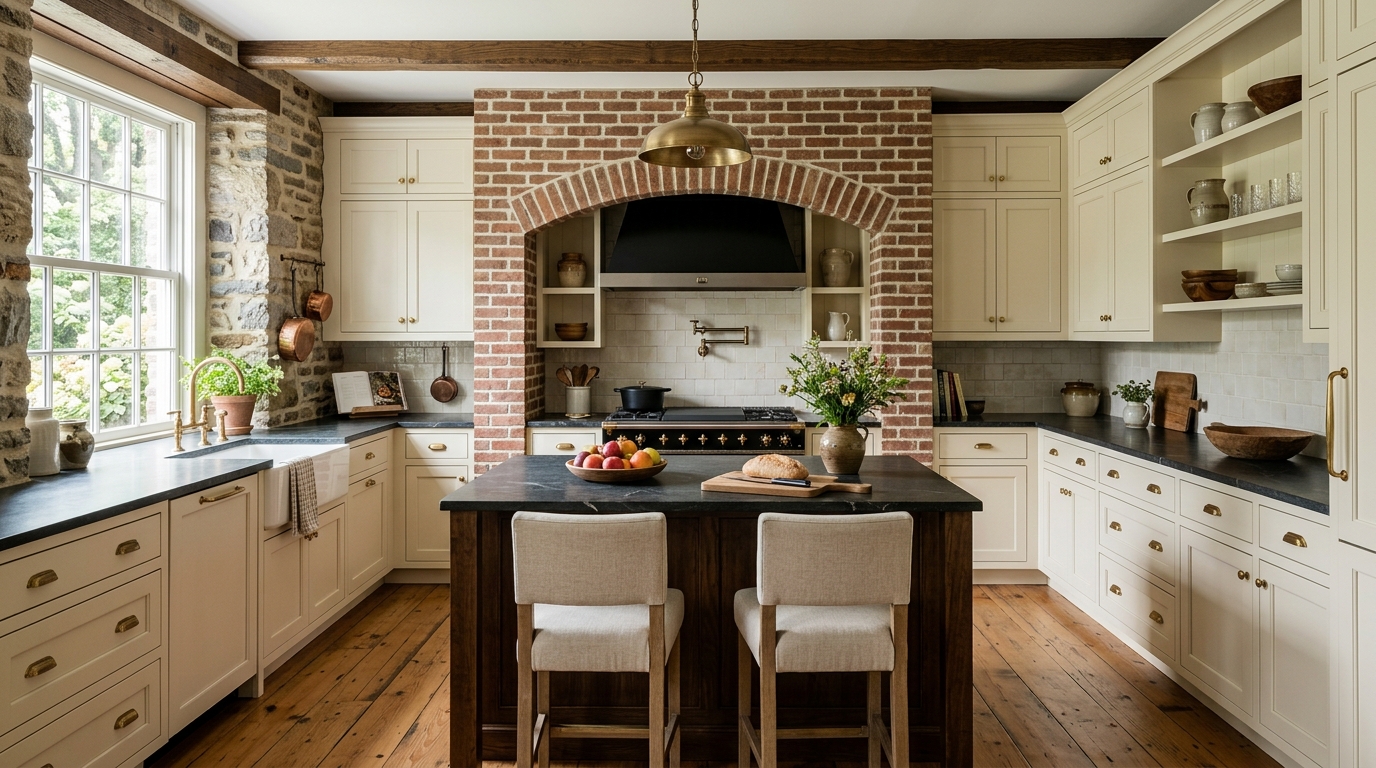 PAPennsylvania PAPennsylvania | $44,900 | +$32,300 | $12,600 | 72% | Read guide |
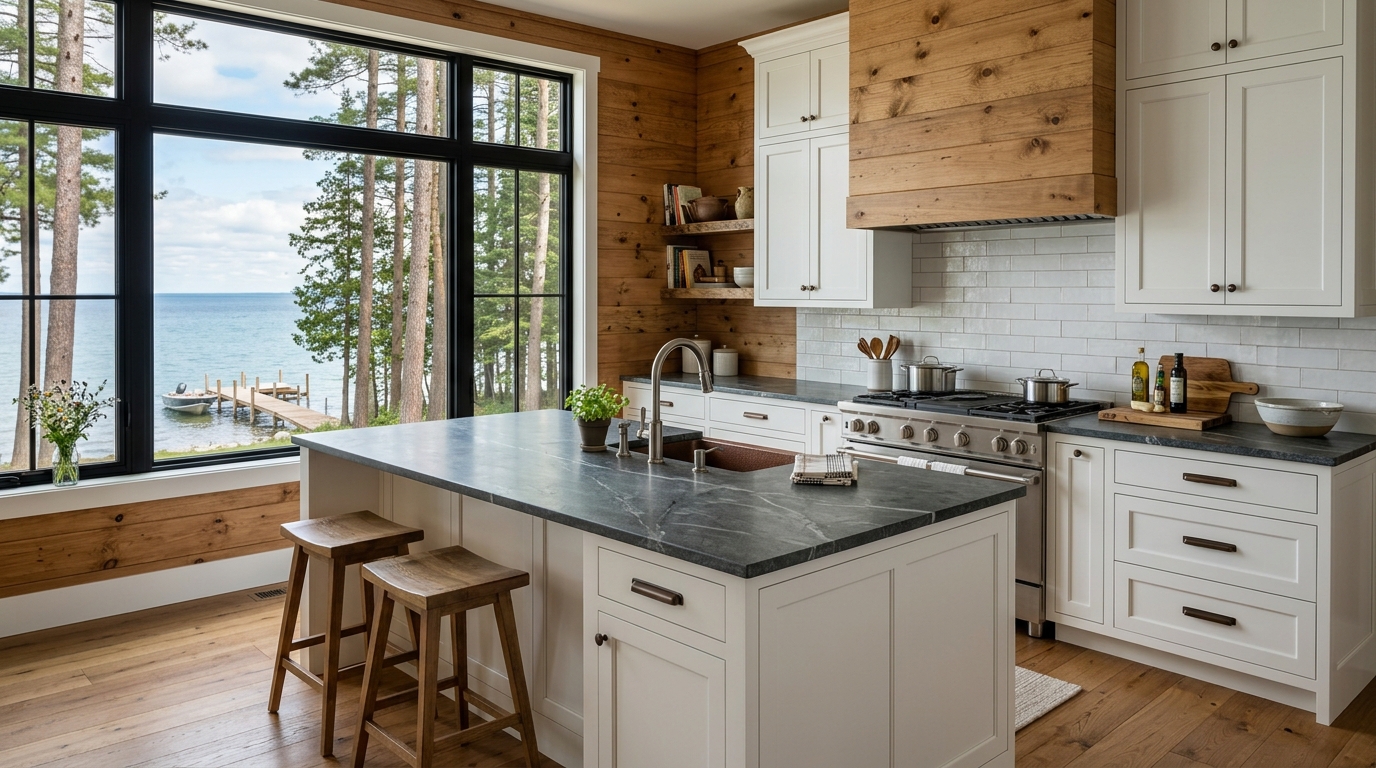 WIWisconsin WIWisconsin | $41,000 | +$29,500 | $11,500 | 72% | Read guide |
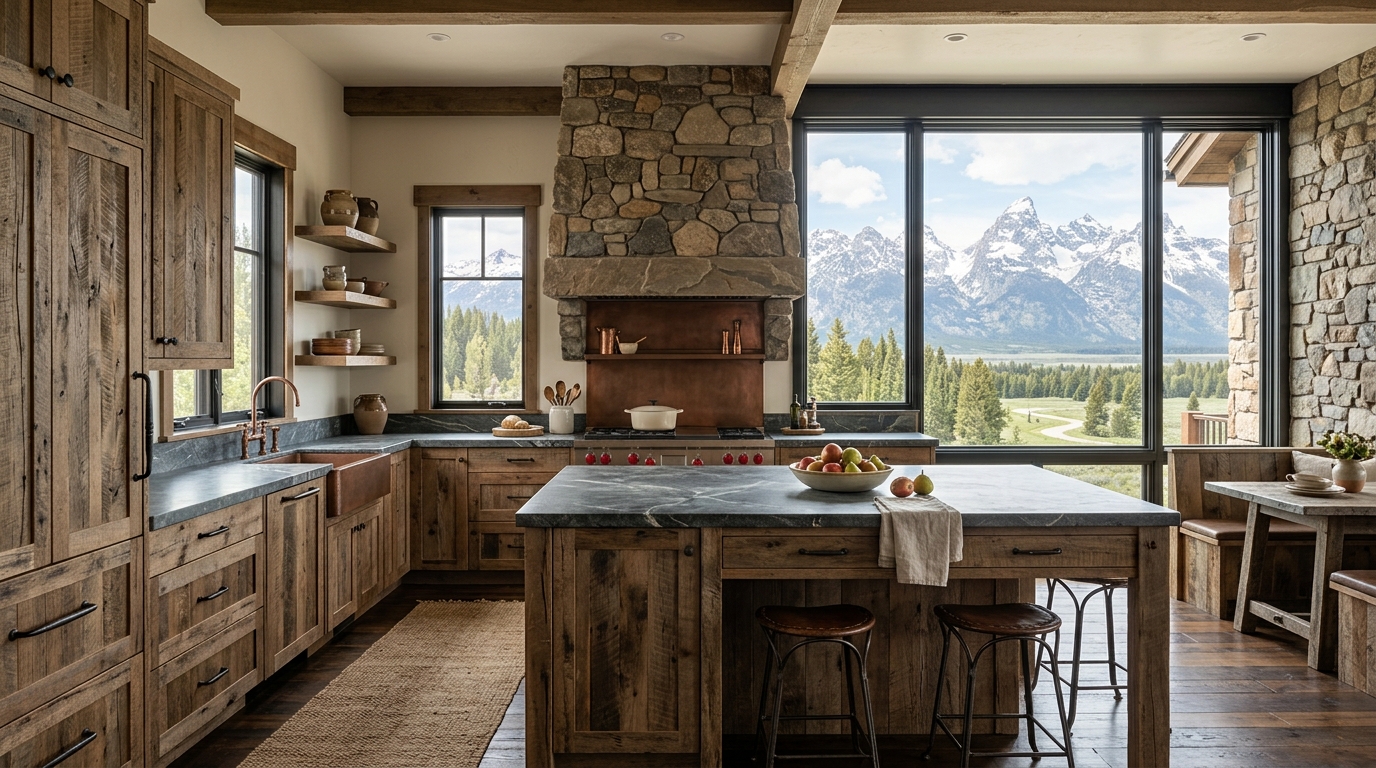 WYWyoming WYWyoming | $42,700 | +$30,700 | $12,000 | 72% | Read guide |
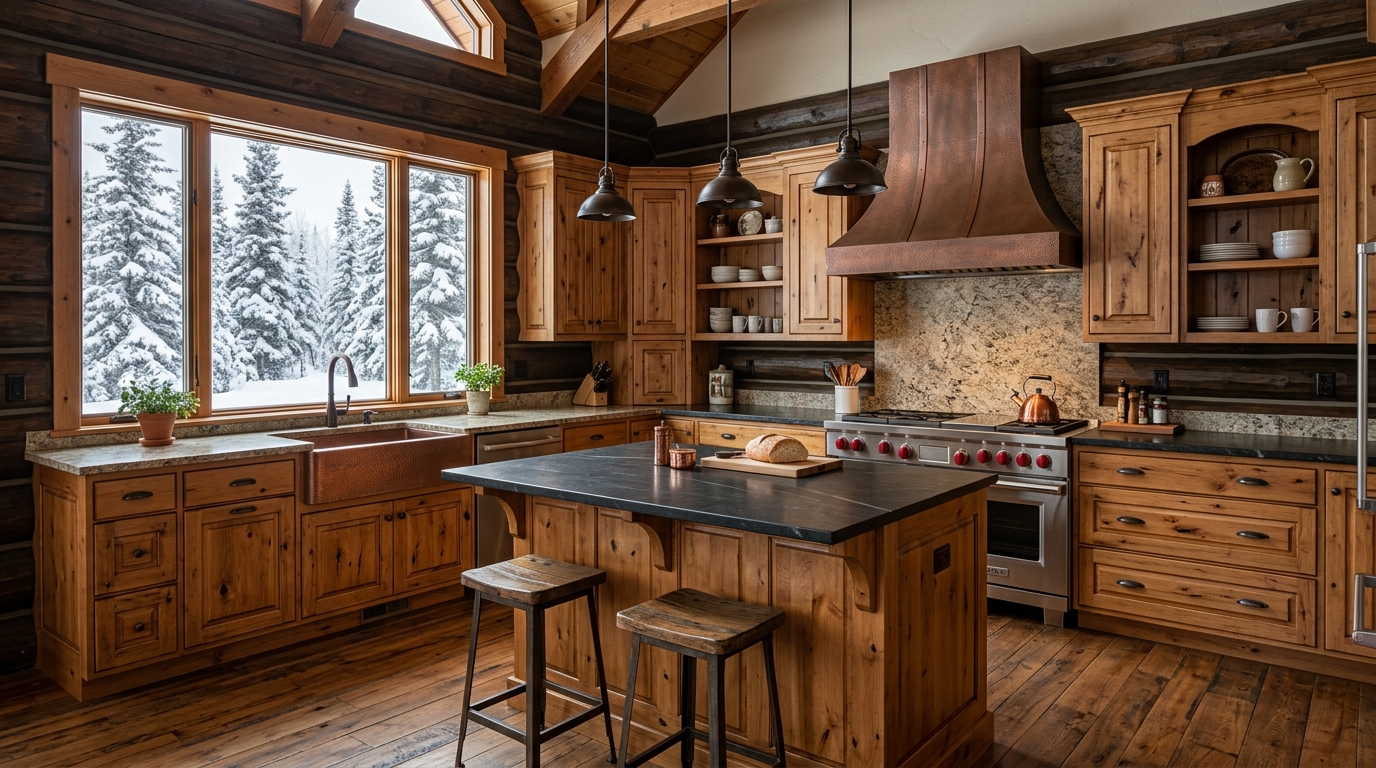 AKAlaska AKAlaska | $59,500 | +$42,200 | $17,300 | 71% | Read guide |
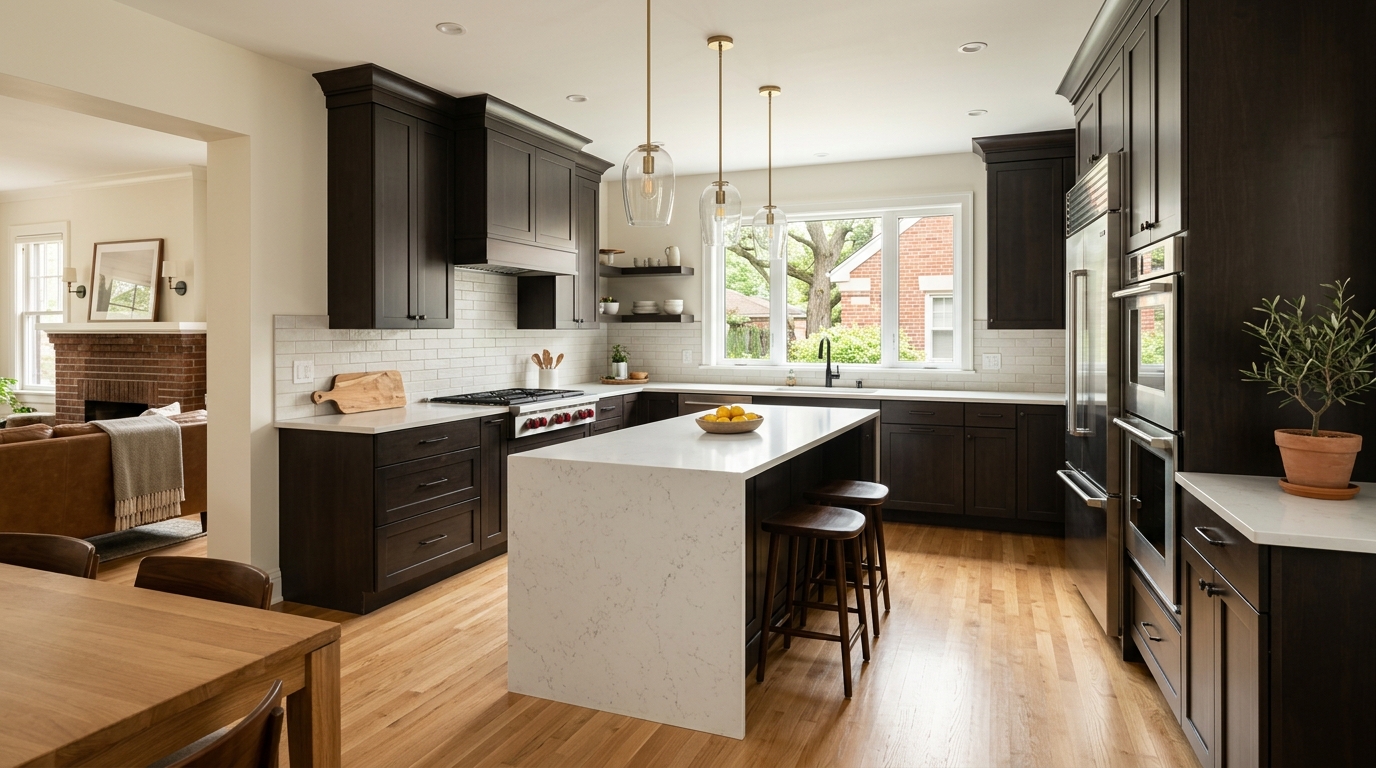 ILIllinois ILIllinois | $41,900 | +$29,700 | $12,200 | 71% | Read guide |
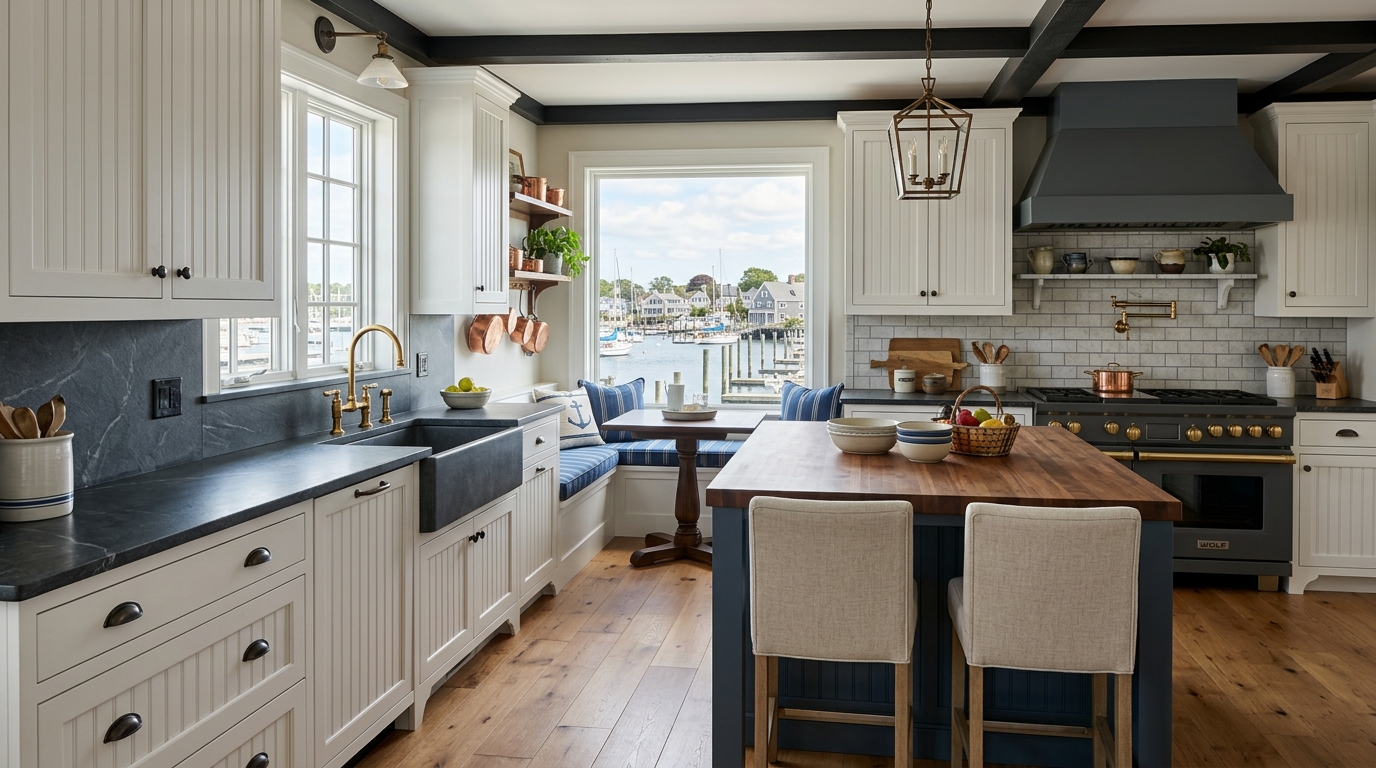 MEMaine MEMaine | $49,300 | +$35,000 | $14,300 | 71% | Read guide |
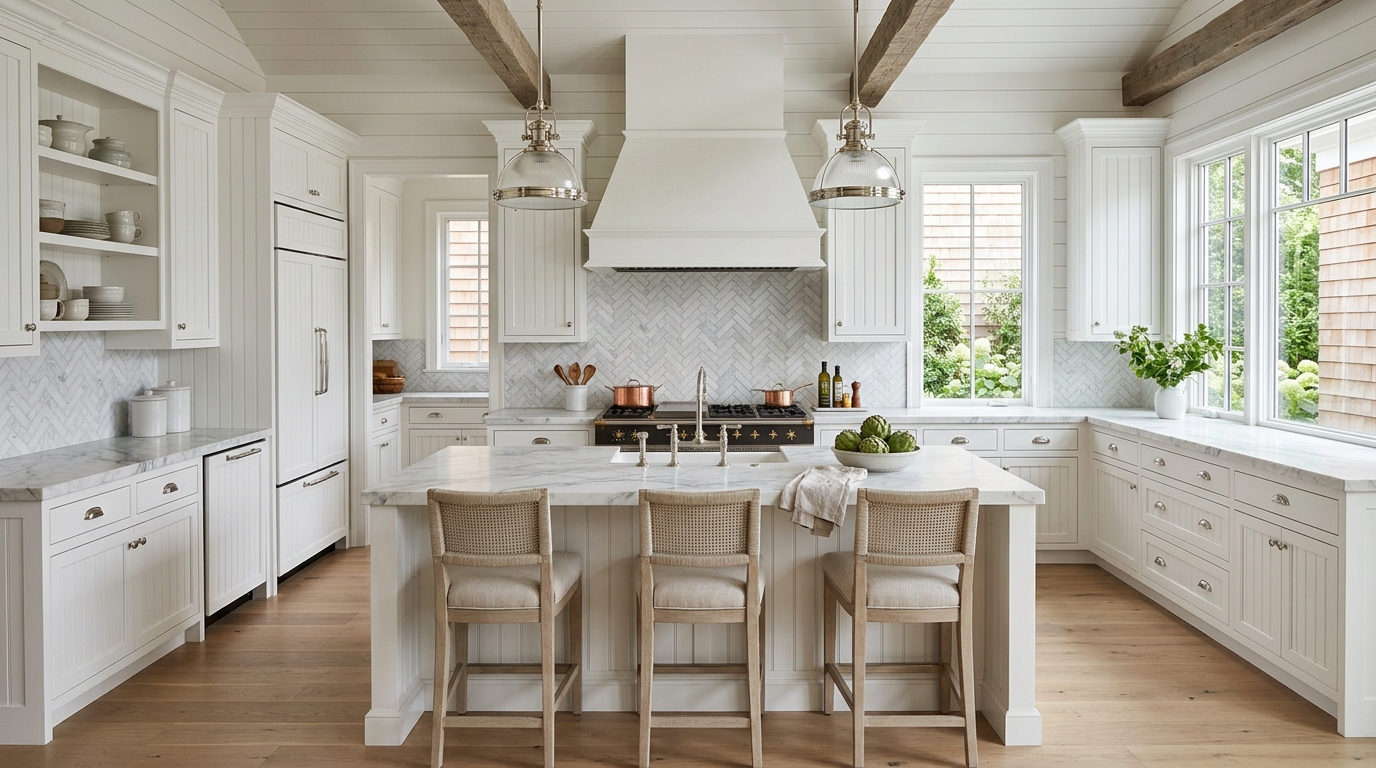 RIRhode Island RIRhode Island | $53,700 | +$38,100 | $15,600 | 71% | Read guide |
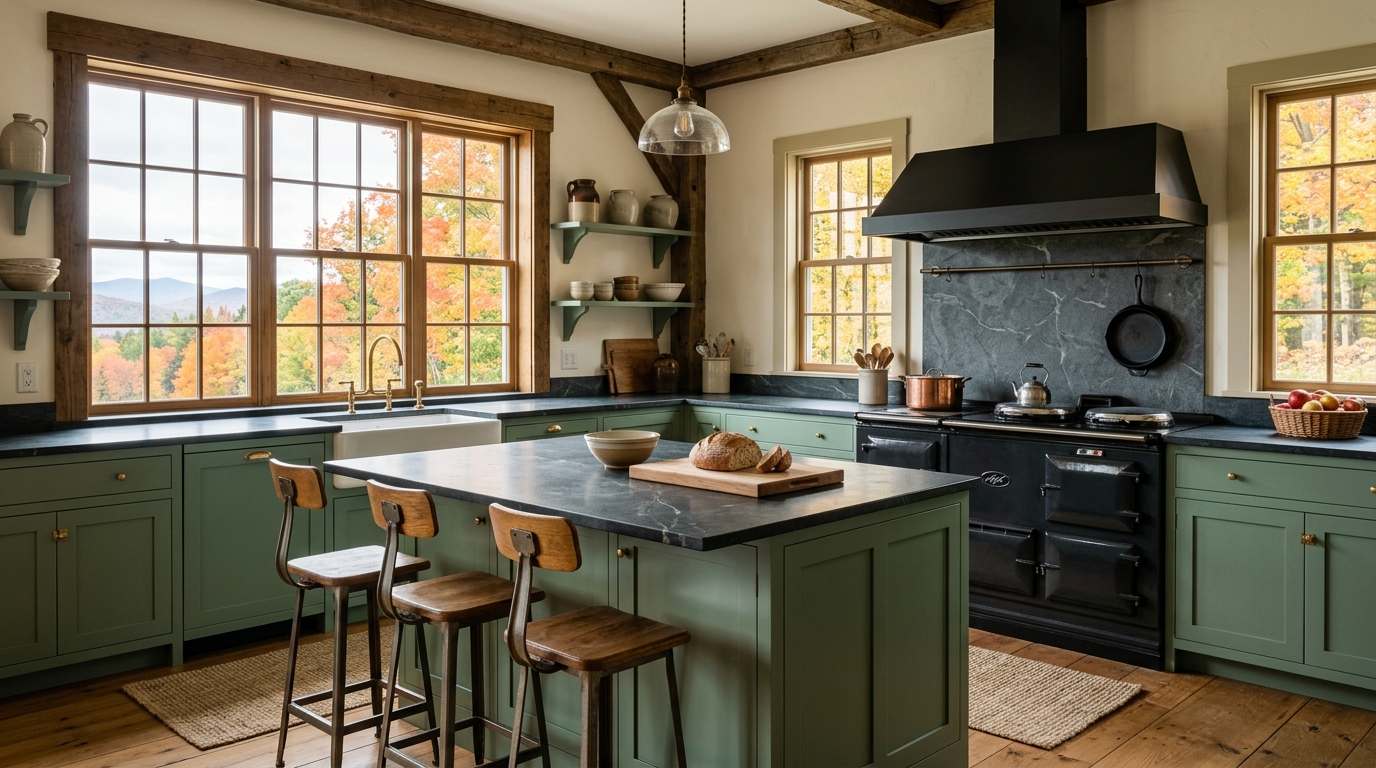 VTVermont VTVermont | $48,400 | +$34,400 | $14,000 | 71% | Read guide |
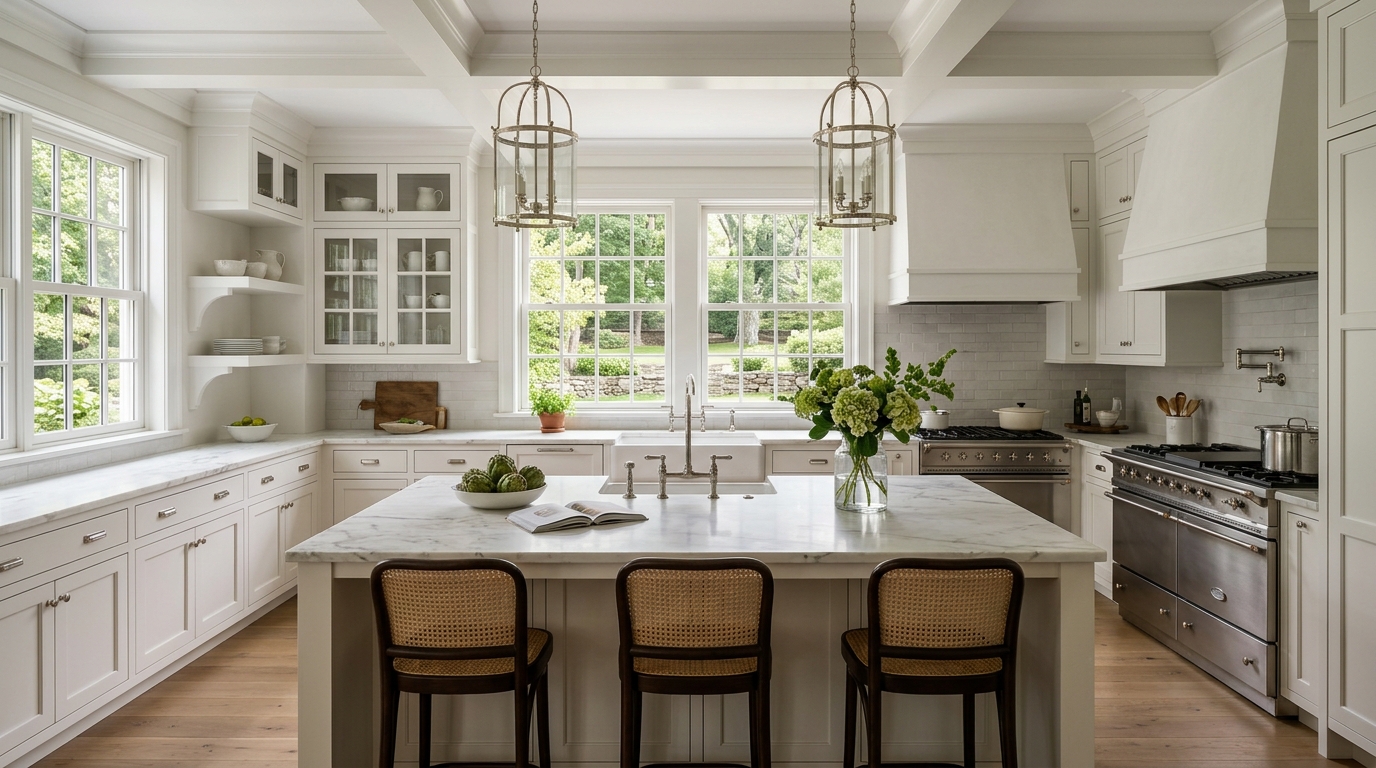 CTConnecticut CTConnecticut | $57,200 | +$34,900 | $22,300 | 61% | Read guide |
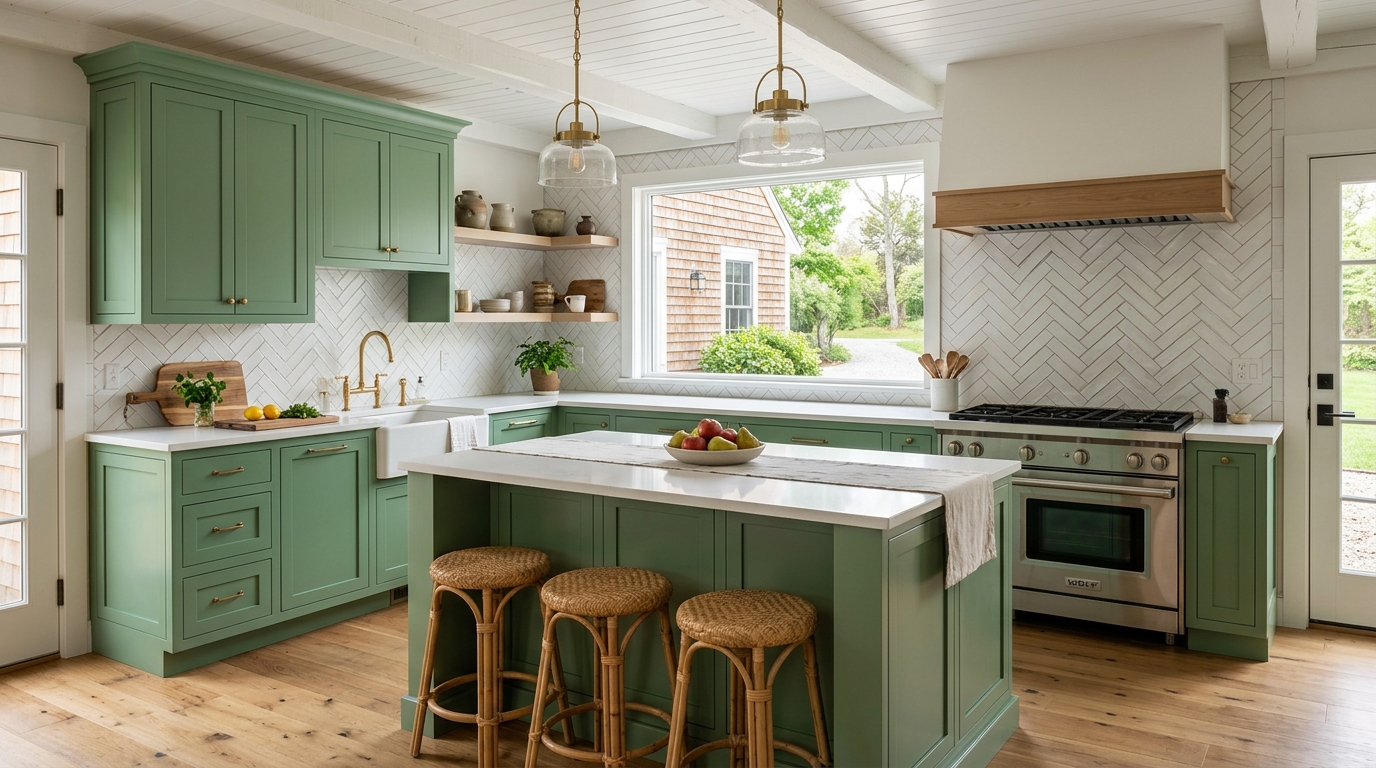 MAMassachusetts MAMassachusetts | $58,100 | +$34,300 | $23,800 | 59% | Read guide |
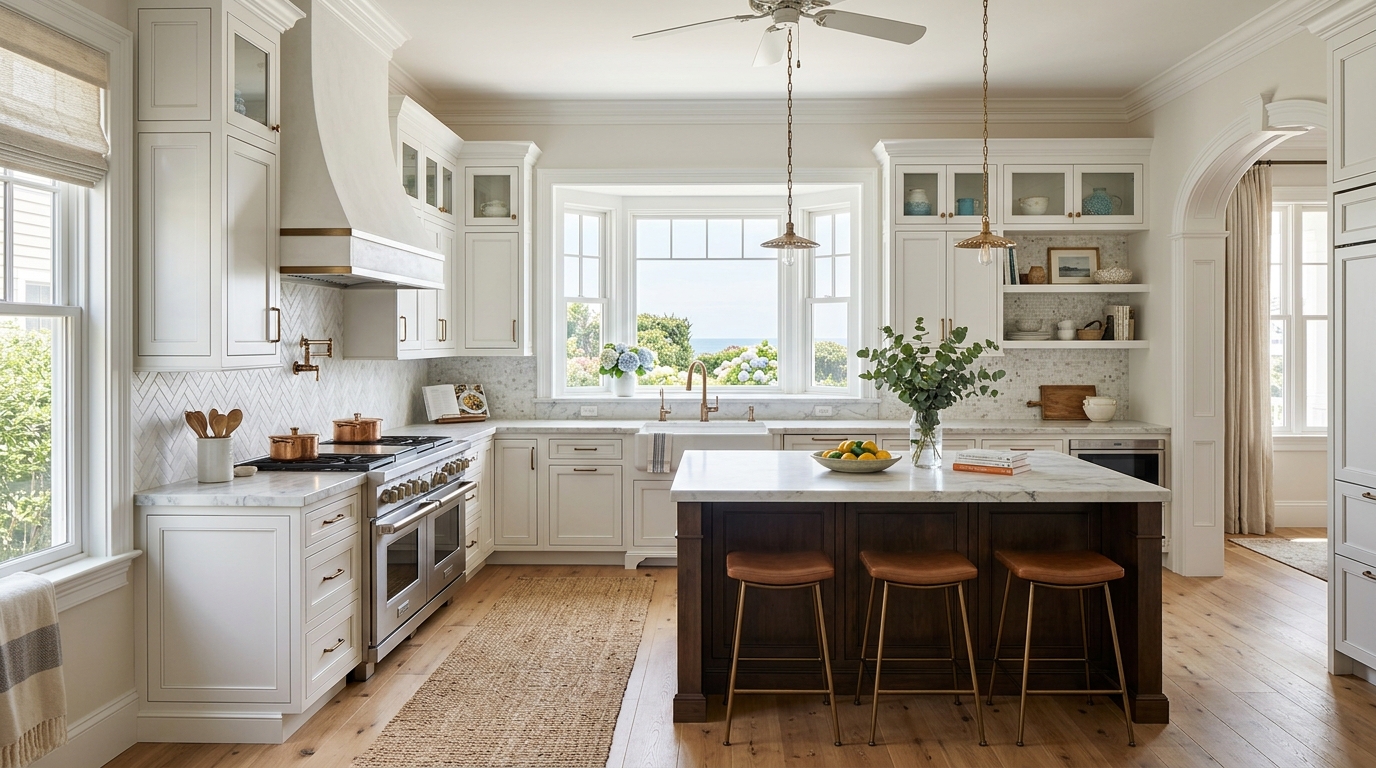 NJNew Jersey NJNew Jersey | $56,300 | +$33,200 | $23,100 | 59% | Read guide |
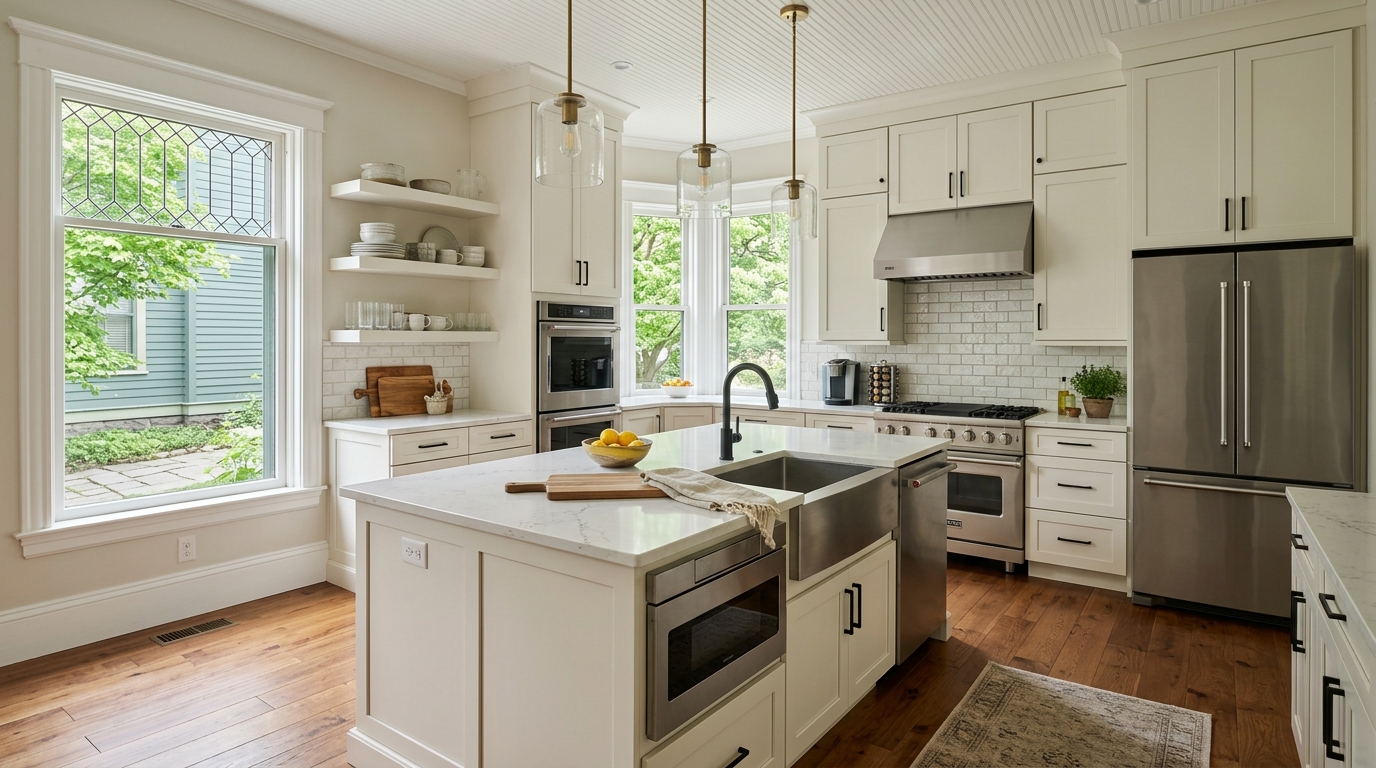 NYNew York NYNew York | $61,600 | +$34,500 | $27,100 | 56% | Read guide |
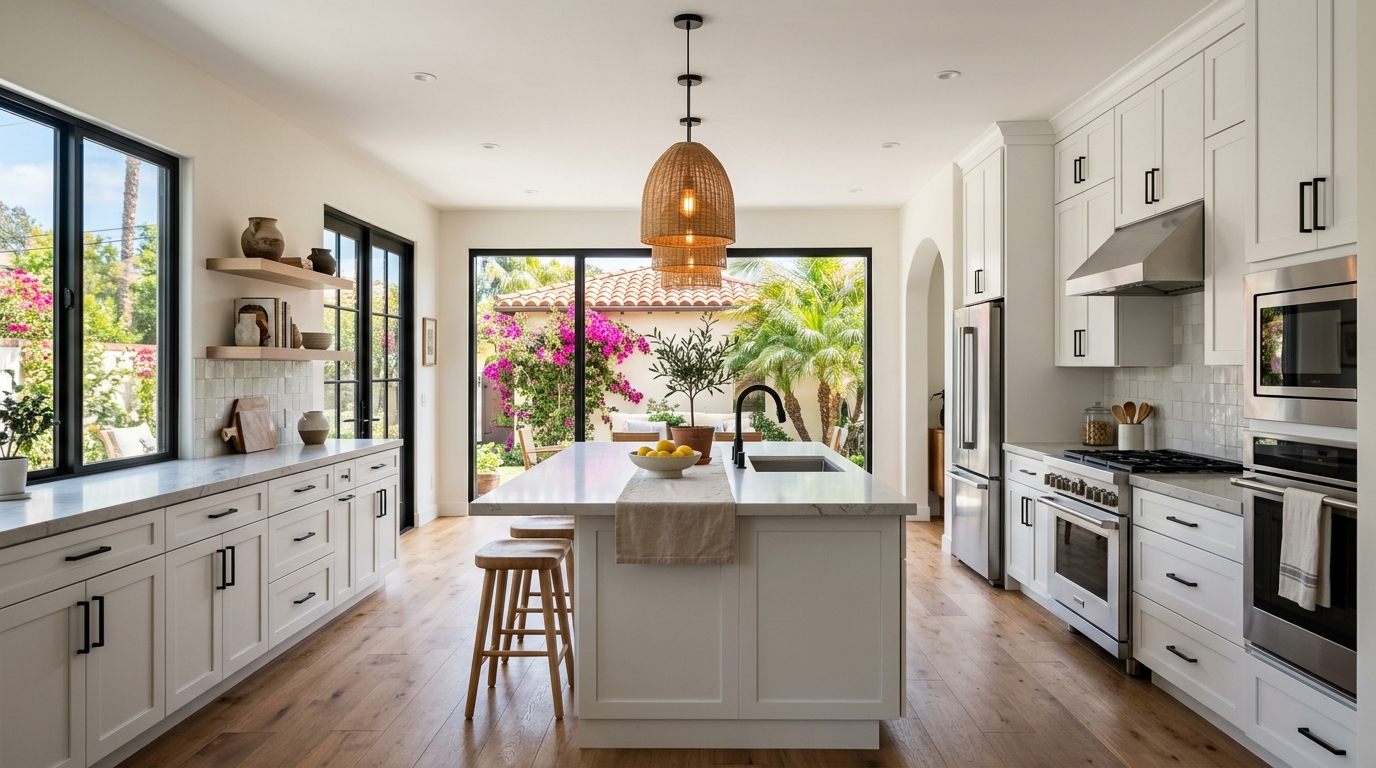 CACalifornia CACalifornia | $61,600 | +$32,000 | $29,600 | 52% | Read guide |
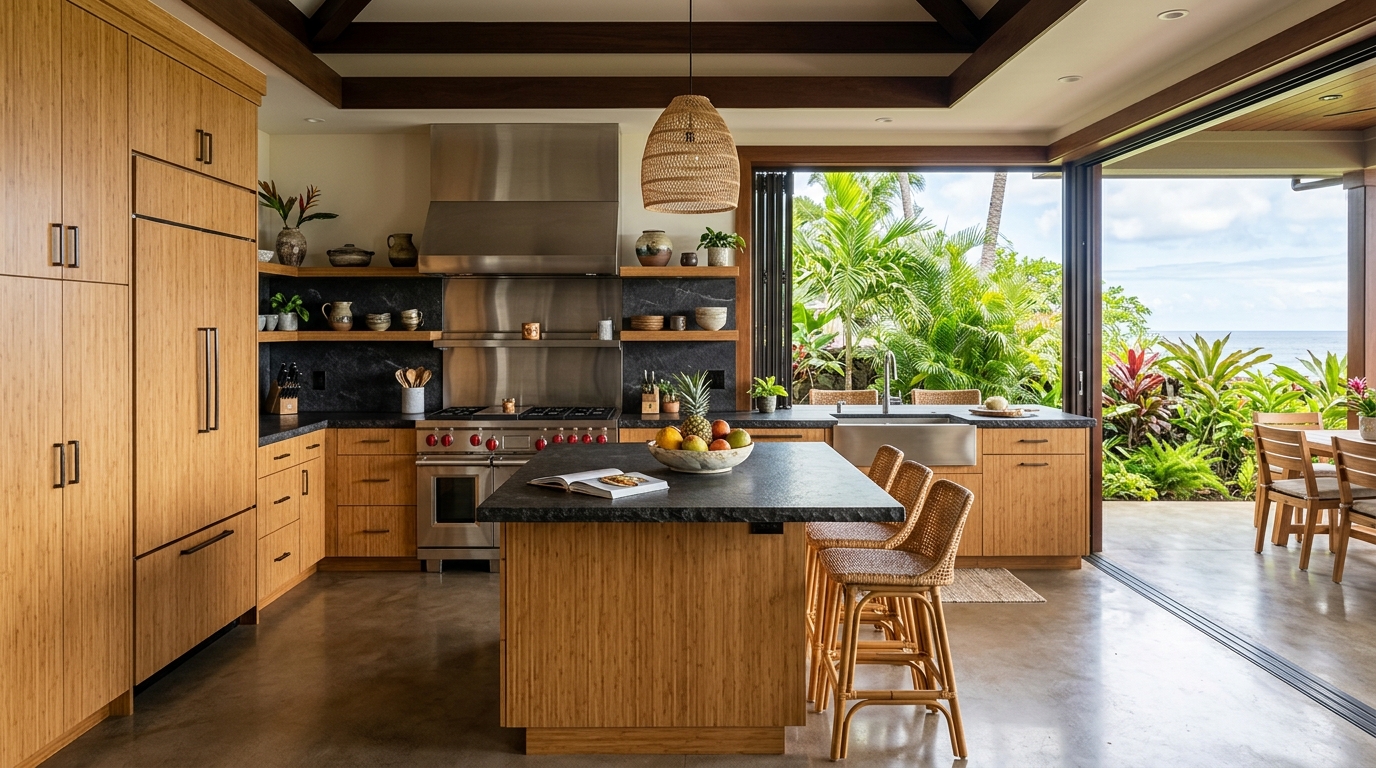 HIHawaii HIHawaii | $68,300 | +$35,500 | $32,800 | 52% | Read guide |
All-50 main atlas
Kitchen cost by state — every state
The full sortable atlas with cost-index, low, high, and mid for all 50 states.
Open the main atlas
First-time buyer atlas
Cheapest states for mid-grade kitchen remodels
Same data, framed for first-time buyers: which states deliver mid-grade floors below the national midpoint.
See the cheapest ranking
What's the ROI on a new kitchen in 2026?
The 2026 national average ROI for a mid-grade kitchen remodel is 73% at resale — for every $1.00 spent on new floors, the seller recoups about $0.73 when the home sells. Top-5 best-ROI states: North Carolina (85%), Georgia (84%), Tennessee (84%), Florida (82%), South Carolina (82%). These are hot Sunbelt growth markets where buyers actively reward turn-key listings and days-on-market is short enough that kitchen remodelings compound less carrying cost.
Which states have the lowest kitchen ROI?
Five states with the softest kitchen ROI in 2026: California (52%), Hawaii (52%), New York (56%), Massachusetts (59%), New Jersey (59%). These markets have slower resale velocity and less buyer willingness to pay a premium for new floors specifically — a kitchen is still a positive ROI move, just a smaller multiplier than in growth markets.
Does a new kitchen always pay back at sale?
No kitchen remodeling fully recoups at sale in any US state in 2026 — the best states return 73-75%, the worst around 58-60%. Kitchens are rarely about pure ROI in saturated markets; it's about reducing days-on-market and unlocking competing buyer offers. The right way to think about it: a $40K kitchen install that returns $9K isn't a $5K "loss" — it's a $5K cost to make the home sell 2-4 weeks faster and at the top of its price band rather than the middle.
Which kitchen scope delivers the best ROI?
Mid-tier semi-custom cabinets paired with quartz countertops and a new mid-range appliance package is the highest-ROI kitchen combo across nearly every state. Custom cabinets add 4-6 percentage points of ROI over semi-custom in high-end markets (CA, NY, MA, CT), but add nothing in mid-cost markets — buyers can't tell the difference and you've paid 50% more for the cabinet boxes. Pro-grade appliances (Wolf / Sub-Zero) have the lowest incremental ROI of any kitchen spend (typically 35-45% recoup) outside of $1.5M+ homes.
When is the best time to remodel before selling?
2-4 months before listing. That's enough time for any installation odors and dust to clear, the cabinets to settle through their first humidity cycle, and the appliance manufacturer warranties to be active for buyers, but not so far in advance that the kitchen shows daily-use wear before the listing photos are shot. Sellers who remodel 12+ months before listing typically see ROI 5-10 percentage points lower than the table above suggests, because the upgrade no longer reads as "brand new" to buyers.