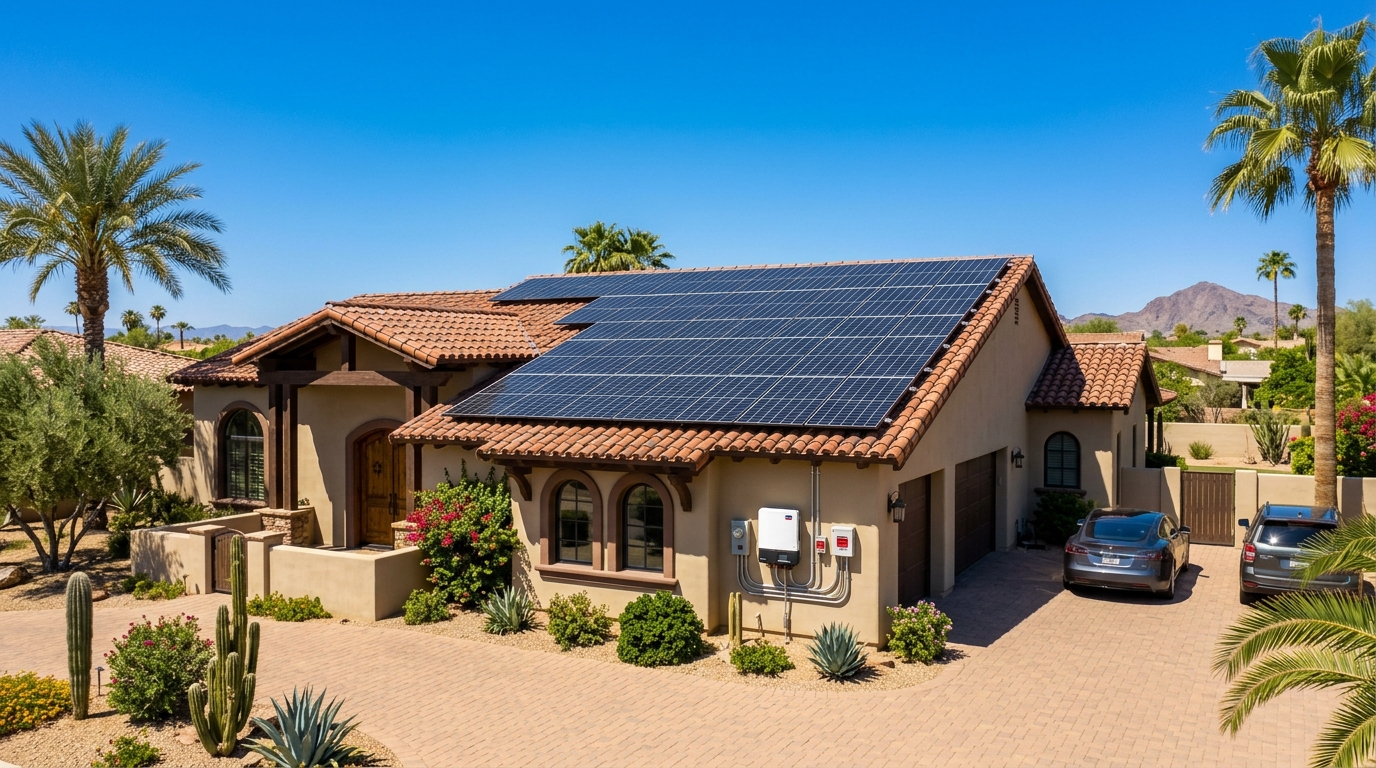
Solar Panels
Solar Panel Cost in Arizona 2026 — APS, SRP, and the Net-Billing Reality
Arizona has the best sun resource in the lower 48 (5.5-6.5 peak sun hours/ day) but the worst rate structure for new solar customers among major sunny states. Arizona moved off true net metering in 2017; the current system is "net billing" where exported energy is credited at wholesale-ish rates (~$0.07/kWh) while you import at retail (~$0.13-$0.17/kWh). Practical result: payback periods are 8-13 years in 2026 — better than NEM 3.0 California but worse than Florida or Texas-with-good-REP. Plus the heat-derate that pulls 12-20% off rated panel output. Here's the 2026 Arizona solar math.
The 2026 Arizona solar baseline (typical 8 kW system)
- Gross cost (before incentives): $14,500-$21,500 ($1.80-$2.70 per watt).
- Federal tax credit (30% §25D): reduces cost by $4,350-$6,450.
- Arizona state tax credit (25%, capped at $1,000): additional $1,000 off.
- Net cost after federal + state credits: $9,150-$14,050.
- With battery added (10 kWh): add $9,000-$13,500 gross / $6,300-$9,450 net.
- Typical payback period: 8-13 years (best with battery + SRP customers on EZ-3 plan; worst with APS customers on legacy net-billing).
State-adjusted by system size and roof type: Arizona solar cost calculator.
The net-billing reality (not net-metering)
Most new Arizona solar customers are NOT on 1:1 net metering. The Arizona Corporation Commission switched the major investor-owned utilities (APS, TEP) to "net billing" in 2017. Practical mechanics:
- You import: energy from the grid at retail rate (~$0.13-$0.17/kWh).
- You export: excess solar at "export rate" — currently ~$0.078/kWh for APS (2026 lock-in), ~$0.087 for TEP. The rate decreases over time per ACC formula.
- Practical impact: exported energy is worth roughly HALF what imported energy costs. A system designed for 100% offset on paper saves you ~65-75% of your bill.
- Workaround #1: Right-size the system to your daytime load only (no export oversizing). This minimizes exposure to the export-rate gap.
- Workaround #2: Pair with a battery. Time-shift your solar to evening peak hours instead of exporting at $0.078 and importing at $0.16. This is why battery attach rates in Arizona have jumped to ~55% of new installs.
Utility-by-utility (the biggest factor in your payback)
- APS (Arizona Public Service) — 1.4M customers, mostly Phoenix metro. Standard residential rate ~$0.14/kWh. Export rate $0.078/kWh. Saver Choice Max + required time-of-use rate for solar customers. 8-12 year payback typical.
- SRP (Salt River Project) — 1.1M customers, Phoenix east valley + parts of Tempe, Mesa, Scottsdale. Municipal-style utility. Solar customers required on E-27 Customer Generation Price Plan — demand charges + lower export credit. Slightly worse economics than APS but more predictable.
- TEP (Tucson Electric Power) — 460K customers, Tucson metro. Net-billing identical to APS. Slightly higher export rate (~$0.087/kWh). 9-12 year payback.
- UNS Electric (Mohave County, parts of S. AZ): Same TEP structure (same parent company).
- Co-ops + smaller utilities: Vary widely. Some still offer net metering. Always get current terms in writing.
The heat-derate that's bigger than you think
Solar panels are rated at STC (Standard Test Conditions = 25°C / 77°F panel temperature). Arizona's brutal summer pushes panel temperatures to 60-70°C (140-160°F). Practical consequences:
- Output drops 0.3-0.5% per degree Celsius above 25°C. At 65°C panel temp, you're losing 12-20% of rated output.
- A "10,000 kWh/year" estimate from a Phoenix installer often delivers 8,200-8,800 kWh — closer to 85% of nameplate.
- Demand actual PVWatts modeling using TMY data for your zip code (not just nameplate × peak sun hours).
- Mitigations: Slightly raised standoffs (1.5"-2" gap instead of flush mount) cut panel temps 4-7°C. Choose panels with low temperature coefficient (LG, REC, Maxeon — usually -0.27-0.30%/°C vs. budget panels at -0.4%/°C).
Arizona solar pricing by metro
- Phoenix metro: Baseline AZ pricing. 200+ active installers, real competition.
- Tucson: 0 to +5% vs Phoenix.
- Prescott / Flagstaff: +10-18% vs Phoenix. Limited installer pool, drive time, occasional snow-load engineering.
- Sedona / Cottonwood: +12-20%.
- Yuma: 0 to +10%.
- Rural AZ: ±15% depending on installer drive distance.
Where the money goes (typical $17K 8 kW Phoenix system)
- Panels (~20 panels @ 400W): $4,400-$6,400
- Inverter (string or microinverters): $1,500-$3,200
- Racking + balance-of-system: $1,200-$2,200
- Labor + installation: $3,500-$5,200
- Permits + interconnection: $300-$900
- Design + engineering: $400-$800
- Sales + overhead + warranty: $2,800-$4,300
Permits + interconnection (Arizona specifics)
- Permit cost: $200-$700 most Phoenix metro cities; $300-$900 Tucson.
- Permit review: Same-day to 2 weeks.
- Interconnection (APS, SRP, TEP): 3-8 weeks for PTO.
- Inspections (2): Building + electrical, final.
The 4 line items that surprise Arizona homeowners
- The mandatory time-of-use rate plan. APS solar customers MUST be on a time-of-use plan (typically Saver Choice Plus or Saver Choice Max). Peak hours: 4-7 PM. Without a battery, you're importing expensive evening energy AFTER your solar production dies. Run the math carefully.
- The SRP demand-charge surprise. SRP solar customers on E-27 face demand charges (highest 30-minute usage in peak hours, multiplied by ~$30/kW). A single AC start at 6 PM can spike your bill. Strongly favors battery installation.
- Roof condition assessment. Arizona heat ages asphalt shingles faster than national average. 12-year-old AZ shingles are often functionally equivalent to 18-year-old shingles in milder climates. Installers may refuse to install on 10+ year roofs.
- HVAC oversizing problem. Many AZ homes have oversized AC units that draw huge inrush current. If your inverter is sized for solar output but not AC start surge, you'll trip the inverter. Discuss panel sizing with your installer; consider hybrid inverters with surge ratings.
Best time of year to install in Arizona
- July-September (off-season): 10-18% discount. Heat slows installer schedules.
- March-May: Sweet spot. Comfortable for installers, fast permits, full summer of production ahead.
- October-February: Peak snowbird-season demand. Highest pricing, longest lead times.
Trusted Arizona-specific guidance
- Arizona solar panel cost calculator
- Arizona renovation cost drivers
- Energy efficiency upgrades
- Bathroom remodel in Arizona — same climate factors
Bottom line
A typical 8 kW Arizona solar system in 2026 runs $14,500-$21,500 gross / $9,150-$14,050 net after the federal + state credits. Arizona has the best sun in the U.S., but net-billing rates (not net-metering) mean payback is 8-13 years — and adding a battery to capture peak-hour evening usage is the single highest-leverage move you can make. Right-size the system to daytime load only, demand PVWatts modeling using actual Arizona TMY data, choose low-temperature-coefficient panels, and verify your roof has 8+ years of asphalt life remaining. Run our Arizona solar calculator for your scope.
More cost guides for Arizona
Planning multiple projects? Every other 2026 Arizona cost guide carries the same state-specific labor and pricing detail.
- Solar Buyer's GuideArizona Solar Export Rates (2026): APS, SRP, TEP & the RCP Annual Step-Down
- Cost GuideBasement Finishing Cost in Arizona 2026
- Bathroom RemodelBathroom Remodel Cost in Arizona 2026 — Phoenix Heat, Hard Water, and the Permit Discount
- Cost GuideDeck Construction Cost in Arizona 2026
- Fence InstallationFence Installation Cost in Arizona 2026 — CMU Block Walls, HOA Reality & UV Lifespan
- Cost GuideFlooring Installation Cost in Arizona 2026
- Cost GuideHardscape Installation Cost in Arizona 2026
- HVACHVAC Cost in Arizona 2026 — Phoenix Summer-Load Math + APS/SRP/TEP Heat-Pump Rebates
- Cost GuideIn-Ground Pool Installation Cost in Arizona 2026
- Cost GuideKitchen Remodel Cost in Arizona 2026
- Cost GuideLandscaping Cost in Arizona 2026
- Cost GuidePainting Cost in Arizona 2026
- Cost GuideRoof Replacement Cost in Arizona 2026
- Window ReplacementWindow Replacement Cost in Arizona 2026 — Why AZ Heat Demands a Specific Glass Spec
Cost by state for this project
State-adjusted ranges with local labor and material multipliers.
Keep reading
From the pillar series
See how your state ranks for 2026 solar payback →
All 50 US states ranked by payback years on the same $200/mo baseline. Hawaii 3.1 yr, MA 3.7 yr, CT 4.1 yr down to ND 11.5 yr.
See the 50-state ranking →